
2016 got off on the wrong foot. By January 20th the index was down north of 11 percent (intra-day), followed by a powerful rally off of the February 11th low. When it was all said and done, the S&P 500 rose 0.77 percent in the first quarter. It was a roller-coaster three months (grey box in Chart 1).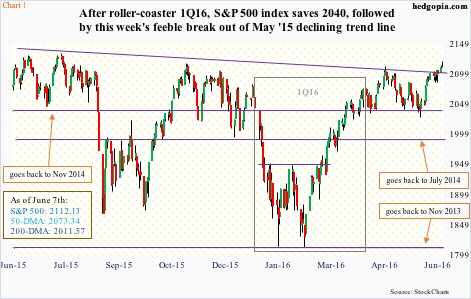
During the quarter, U.S.-based equity funds lost just north of $44 billion (courtesy of Lipper), NYSE margin debt shrunk by $15 billion – from $461.2 billion in December last year to $445.8 billion in March – and foreigners sold $23 billion worth of U.S. equities (TIC data).
Corporate buybacks, however, did not disappoint, coming in at $160.1 billion in the first three months of the year. This is second only to $172 billion in 3Q07. The four-quarter rolling total was $588.1 billion in 1Q16, essentially on par with $589.1 billion in 4Q07 (Chart 2).
These are massive numbers, and have been a constant source of bidding under the market.
Howard Silverblatt, of S&P, the person who tallies these numbers, points out that in 4Q15 25.8 percent of S&P 500 companies bought back to reduce the share count by at least four percent. This followed seven quarters of 20-23 percent of these companies reducing by that much. In other words, the trend in share count reduction accelerated in 4Q15. In 1Q16, this rose further to 28 percent.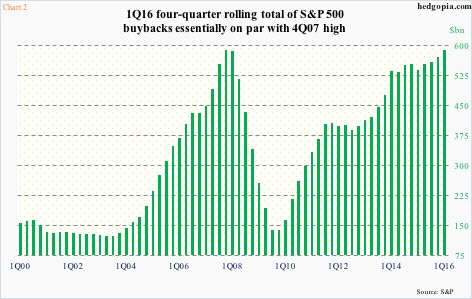
There is both good and bad in this.
The bad is that, even after buying back $160 billion worth of shares the S&P 500 only managed a 0.77-percent increase during the quarter. In the last four quarters, buybacks have totaled $588 billion. The index peaked in May last year at 2134.72, which is yet to be surpassed. In fact, the S&P 500 has essentially gone sideways in the past 16 months.
The good is that in the face of other sources of buying running dry there is at least one ready buyer – with cash and willingness to take on debt.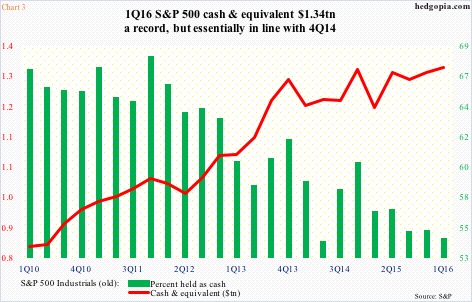
In 1Q16, the S&P 500 Industrials (old) held $1.34 trillion in cash & equivalent (C&E). [The S&P Industrials (old) consists of the S&P 500 minus financials, utilities, and transportation issues since these companies maintain high cash reserves as part of their normal operating process.]
The 1Q16 total was a new record, yet essentially unchanged from $1.33 trillion in 4Q14 (Chart 3). Viewed this way, C&E has been flattish the past six quarters. That said, this is still a very healthy level of cash. Plus, taking advantage of a low interest-rate environment, companies have been issuing debt hand over fist.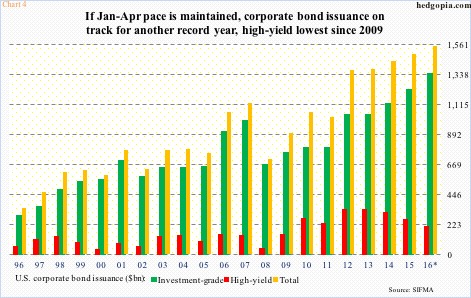
U.S. corporate debt stood at $8.2 trillion in 4Q15 (1Q16 numbers not out yet). At the end of 2Q09, this stood at $6.5 trillion.
Chart 4 throws light on the amount of debt issued by U.S. corporates. In the seven years to 2015, corporate debt issuance totaled $8.7 trillion, with $6.8 trillion in investment-grade and $1.9 trillion in high-yield. Annualizing January-April numbers this year, 2016 is on course for another record year, with $1.3 trillion in investment-grade and $203 billion in high-yield.
Therein lies the problem. Corporations are increasingly relying on debt issuance, even as earnings are decelerating. Not all of this issuance goes toward buybacks of course, but a good chunk probably does.
As stated earlier, 3Q07 saw an all-time high in buybacks, with $589 billion spent in all of 2007. Corporate debt issuance peaked at $1.13 trillion that year, dropping to $708 billion in 2008. Not surprisingly, buybacks tumbled to $340 billion in 2008.
Looking at debt-issuance trend so far this year, buybacks do not seem to be at risk – at least not in 2Q – but risks are increasingly elevated.
Thanks for reading!
