
Later this morning, sales of existing homes for May will be published. On Friday, new home sales come out for the same month.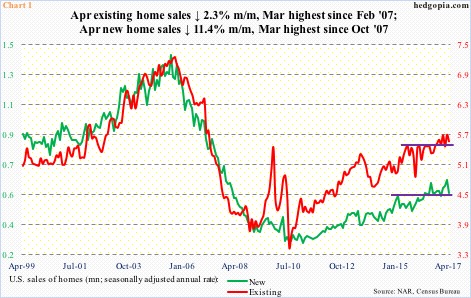
Using a 12-month rolling average, sales of existing homes in April were 5.51 million units and new homes 584,000 units. They were the highest since September 2007 and July 2008, respectively. On this basis, momentum seems intact.
That said, both categories were down month-over-month in April, with existing down 2.3 percent to a seasonally adjusted annual rate of 5.57 million units and new ones down a whopping 11.4 percent to 569,000 units (SAAR).
Sales stand nowhere in comparison versus the bubble highs in 2005. Nonetheless, March was a multi-year high, with existing homes highest since February 2007 and new homes highest since October 2007 (Chart 1).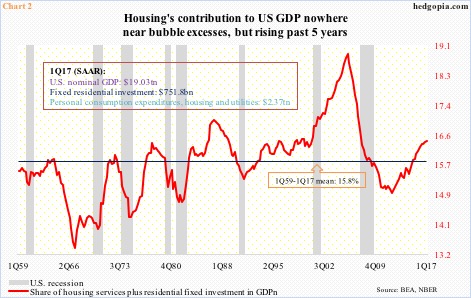
Along the same lines, housing’s contribution to GDP is nowhere near the peak excesses of 2005, but it has been persistently rising the past five years.
In Chart 2, nominal residential fixed investment has been added to personal consumption expenditures in housing and utilities services to calculate a share of nominal GDP (box in the chart for individual numbers). In 1Q17, this stood at 16.4 percent, up from 15 percent in 1Q12 and higher than the 58-year average of 15.8 percent.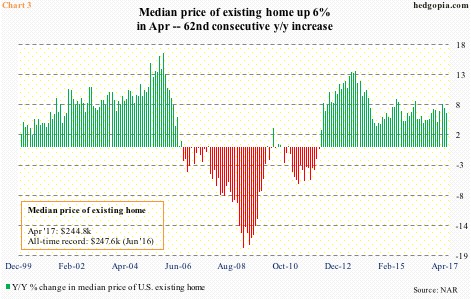
Excesses are seen elsewhere – on the price front.
The median price of an existing home rose six percent year-over-year in April to $244,800. This was the 62nd consecutive y/y increase (Chart 3). The all-time high of $247,600 was recorded last June – well past the prior peak of $230,400 in July 2006.
New homes are the same way. The median price fell 3.8 percent m/m in April to $309,200 but the all-time record of $332,700 last December is not that far away. Once again, the December high was way past the prior high of $262,600 in March 2007 (not shown here).
This has to be negatively impacting affordability, hence sales.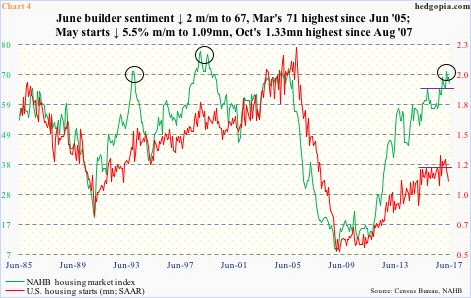
Rather curiously, this has failed to encourage builders to aggressively break new ground. They are not putting money where their mouth is.
In June, the National Association of Home Builders housing market index fell two points m/m to 67. Builder sentiment peaked at 71 in March – the highest since 72 in June 2005. This survey-based enthusiasm (soft data) is yet to translate into something concrete (hard).
In April, housing starts fell 5.5 percent m/m to a seasonally adjusted annual rate of 1.09 million units. Starts peaked at 1.33 million last October. In Chart 4, there is a noticeable – yawning – gap between starts and sentiment.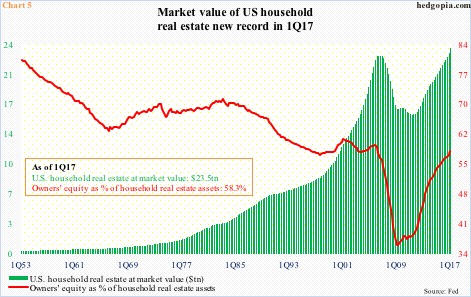
Not surprisingly, the lack of supply puts upward pressure on price, which in due course has the potential to be the victim of its own success, as potential buyers are increasingly priced out.
When this occurs, its adverse impact will be felt in Chart 5.
In 1Q17, U.S. households’ real estate assets (at market value) were $23.5 trillion – a record and past the prior peak of $22.7 trillion in 2Q06. In the same quarter, owners’ equity in household real estate was $13.7 trillion. As a result, the red line in Chart 5 was 58.3 percent in 1Q17 – the highest since 1Q06.
A rise in owners’ equity boosts consumer confidence and by default consumption. But it cuts both ways. Once home prices stop defying the law of gravity, repercussions will be felt in Chart 5 – not to mention the economy.
Thanks for reading! Please share.
