
There is a new entrant in the list of things dollar bulls are having to grapple with. It is the Donald.
Bulls were already locking horns with overbought technicals and non-commercial futures traders who persistently refused to jump on the US dollar index rally bandwagon.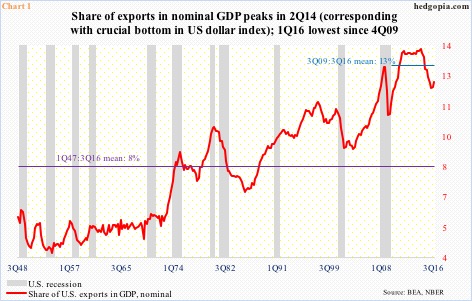
President-elect Donald Trump last Friday told the Wall Street Journal that the strong dollar is killing U.S. companies’ ability to compete.
He has a point.
As a percent of GDP, U.S. exports of goods and services accounted for 12.2 percent in 3Q16. This is higher than the long-term (1Q47-3Q16) average of eight percent, but lower than the post-Great Recession (3Q09-3Q16) average of 13 percent. The all-time high of 13.8 percent took place in 2Q14 (Chart 1). Right around that time, the US dollar index began a parabolic ascent – rallying nearly 26 percent intra-day between July 2014 and March 2015 (Chart 3).
Mr. Trump is concerned because one of his campaign promises is to revive/bring back manufacturing. A strong currency does not help. And strengthen it has.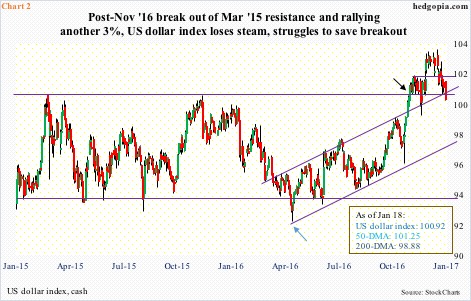
Since May 3 last year (blue arrow in Chart 2) through January 3 this year, the dollar index rallied 13 percent. That is in eight months. Post-election through that high, it rose north of six percent … in less than a month. In the currency land, this is a big move.
Hence his attempt to jawbone, and he succeeded. In part. The dollar index dropped 0.9 percent on Tuesday, slicing through its 50-day moving average. But responding to December’s stronger-than-expected industrial production and consumer price index, and higher interest rates, it jumped 0.6 percent on Wednesday … was not able to reclaim the 50-day, though.
This is a market where $5 trillion exchange hands daily – just too big for any jawboning to work on a sustained basis. Apart from that, post-financial crisis, through quantitative easing and ultra-low rates, major central banks have indirectly all pined for a weaker currency.
With this as a background, it is looking increasingly likely that in the foreseeable future Mr. Trump, or his administration, may feel lesser need to continuously jawbone the dollar down.
Here is why.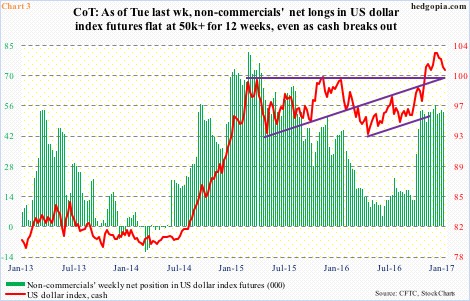
Back in March 2015, the index began to go sideways after jumping nearly 26 percent to 100.71 in nine months (Chart 3). That high was unsuccessfully tested in November that year, when it again retreated after tagging 100.6. In the meantime, it also carved out support at 93-ish. Since that November 2015 high, the index went on to slightly breach that support in May last year, but only to stabilize soon and begin a new uptrend, which culminated in a breakout in November last year, rallying to 103.82 (black arrow in Chart 2).
Ideally, by using a measured-move method, technicians would be eyeing 108 on the dollar index. But it began to weaken as soon as 2017 opened. Bulls apparently expended lots of energy in bringing about the breakout, which they are now struggling to save.
Throughout all this, non-commercials never enthusiastically embraced the rally. When the cash made that high in March 2015, they were net long 81,270 contracts in US dollar index futures. This time around, post-breakout, the most they had was 56,712.
Nonetheless, with 50,000-plus for 12 straight weeks, they still hold a decent size, which has simply gone sideways at a higher plateau. These traders are probably watching how far the rally goes post-breakout.
The cash remains overbought – particularly on a weekly and monthly basis. On the weekly chart, a bearish MACD cross-under is likely.
Long story short, the path of least resistance is down, raising the odds that non-commercials would be tempted to cut back. A rising trend line from last May’s low will be tested around 98.
Thanks for reading!
