
August non-farm job openings fell by 388,000 month-over-month to a seasonally adjusted annual rate of 5.44 million – an eight-month low. This was the largest m/m decrease since August last year. July’s 5.83 million essentially matched 5.79 million in July last year and 5.85 million in April this year. In this respect, before the August swoon, openings were essentially flat, with normal ups and downs in between.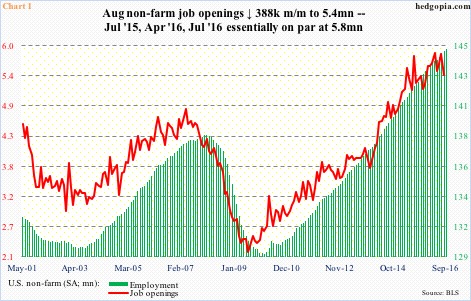
The question is, is this a one-month blip or the beginning of a trend?
Chart 2 plots two ratios: job openings to unemployed and quits to hires. In August, the former dropped the most since December last year. There were 7.85 unemployed Americans in August; their ranks bottomed at 7.44 million in May this year, rising to 7.94 in September. It is a bad combo – the numerator dropping and the denominator rising.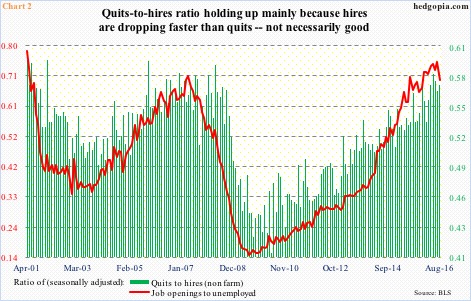
Along the same lines, hires have tumbled – from a cycle high 5.51 million in February this year to 5.21 million in August. The ratio between quits and hires is still holding up as the former is not down as much – 2.98 million in August versus 3.09 million in December last year. Workers feeling comfortable to quit is a good sign – speaks of their conviction to land a new one. That said, quits peaked eight months ago.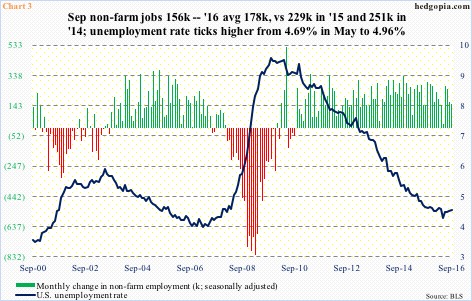
The August drop in job openings led the deceleration in non-farm payroll in September, which produced smaller-than-consensus 156,000 jobs (Chart 3). Non-farm payroll has been softening for a while. Year-to-September, a monthly average of 178,000 has been added, slower than 229,000 in 2015, which itself was slower than 251,000 in 2014.
Jobs momentum is on the wane, with the six-month moving average of change in non-farm payroll below the 12-month for six straight months. In the last 19 months, the six-month is higher than the 12-month in only four months (not shown here).
This is beginning to get reflected in the unemployment rate, which has been flattish at 4.9 percent to five percent for a year. The cycle low was reached in May this year at 4.69 percent, with September at 4.96 percent (Chart 3).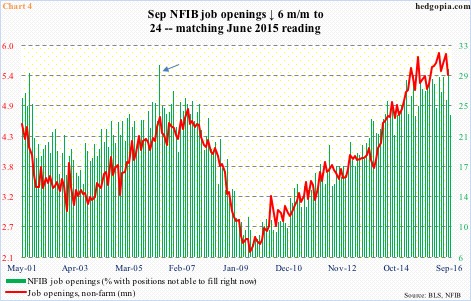
Odds are jobs momentum continues to decelerate.
The National Federation of Independent Business surveys its members to find out, among others, the percentage of job openings they are not able to fill. September fell six points to 24, matching the low in June last year. August’s reading of 30 was the highest since 31 in April 2006 (arrow in Chart 4). The NFIB job openings moves in tandem with JOLTS job openings, which is one month behind. On Tuesday this week, August’s numbers were reported. Assuming the relationship between the two holds, weakness in non-farm job openings does not bode well for the payroll reports to come.
The monthly labor market conditions index suggests as much. September was -2.2, on the heels of -1.3 in August. In eight of the last nine months, the index has been in negative territory. Chart 5 calculates a six-month average, and it has dropped into negative territory … has been that way the last six months. This is the first time in the current cycle the bars in Chart 5 have moved into the red.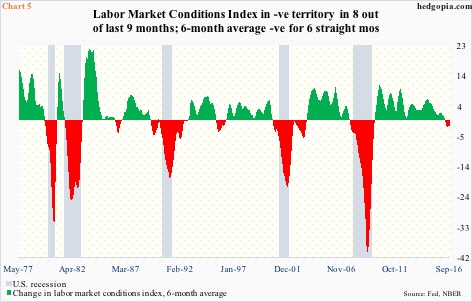
Going back to the late ‘70s, covering five recessions, only twice have the bars in Chart 5 dipped into negative territory without being accompanied by a recession, hence its significance. And worth watching given the deteriorating trend in the previous four charts.
Thanks for reading!
