
The stock market got off on the wrong foot this year… which is probably an understatement.
Using the January 20th intra-day low, the S&P 500 large cap index lost nine percent in 12 sessions, the S&P 400 mid-cap index 13.1 percent, and the Russell 2000 small cap index 15.6 percent.
The higher the risk – perceived or real – the more the drop.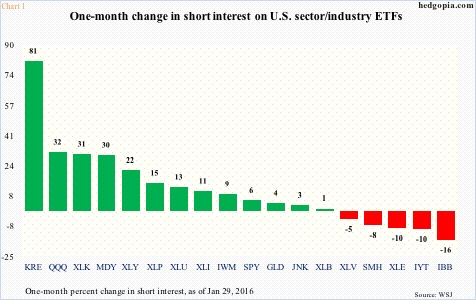
Leading up to the decline, shorts were building positions almost along the same lines. In the one month since the end of 2015, short interest on SPY, the SPDR S&P 500 ETF, went up 5.6 percent, and on IWM, the iShares Russell 2000 ETF, by 9.1 percent. Except that on MDY, the SPDR S&P MidCap 400 ETF, it surged 30.1 percent.
Chart 1 lays out one-month percent change beginning end-2015 in various U.S. sector/industry ETFs. Notice the spike in KRE, the SPDR Regional Banking ETF. Short interest went from 24.5 million at the end of last year to 44.4 million at the end of January. This year by January 25th the ETF was down 18-plus percent.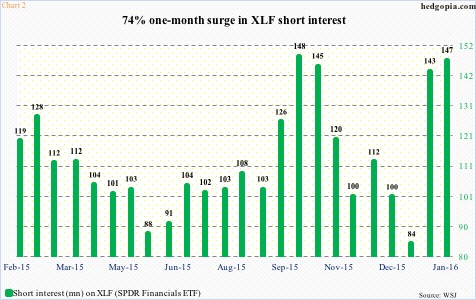
Financials globally got taken to the woodshed as soon as the year opened, and shorts were already aggressively positioned for this. By the January 20th low, XLF, the SPDR Financials ETF, lost nearly 14 percent. At December-end, short interest languished at 84 million. By mid-Jan, this had surged to 143 million, and then to 147 million by January-end (Chart 2).
In Chart 1, next to KRE, the buildup in short interest on QQQ, the PowerShares Nasdaq 100 ETF, and XLK, the SPDR S&P 500 Technology ETF, is equally noticeable – up 32 percent and 31 percent, respectively. By January 20th, the ETFs had lost north of 13 percent and north of 11 percent, in that order.
Shorts were picking and choosing their spots just right. On an index level, short interest has gone up, but not by a huge amount. In the one month since the end of last year, short interest on the NYSE composite rose 5.2 percent and on the Nasdaq composite 3.4 percent (Chart 3). Both indices are still below end-September (2015) highs.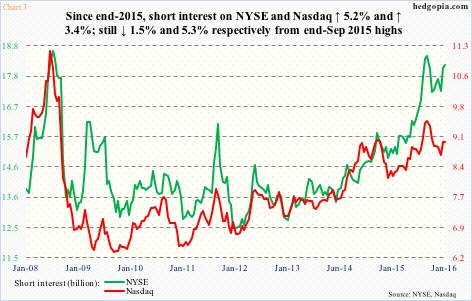
In the aggregate, shorts should be credited for aggressively attacking the sectors that ended up losing the most. Financials, for instance. With this as a backdrop, is there a message somewhere in how they are positioned now?
Perhaps.
XLE, the SPDR Energy ETF, has been a classic example of death by a thousand cuts, having relentlessly dropped since June 2014. In the first reporting period this year (end-2015 through January 15th), short interest went up from 45 million to 49 million. The ETF lost nearly 10 percent during the period. Shorts obviously expected the trend to continue. And they were right. By the January 20th intra-day low, the ETF lost another eight percent.
Except when it was all said and done, the January 15-29th period saw XLE reverse and end up 7.1 percent. Short interest went down big – from 49 million to 41 million (Chart 4). Shorts obviously took their gains, and at the same time decided not to continue to press.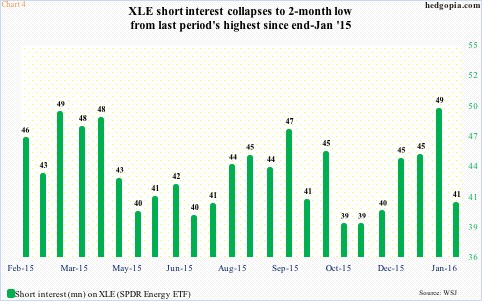
It is possible there is a subtle message here… that being shorts do not expect XLE ($54.09) to undercut the January 20th low near-term.
If this is how these shorts are thinking and for them to be right, the ETF cannot be losing $53. Should this support give away, selling pressure likely renews. But this is not the scenario these shorts were expecting. Not in the latest period, anyway.
Thanks for reading!
