
Is the S&P 500 index (2035.94) resting or struggling at resistance?
Either way, the rather lethargic action the past few sessions is not completely out of the ordinary given the move it has had off February 11th lows. From low to high intra-day, it rallied 13.6 percent, in the process taking care of resistance at 1950, the 50-day moving average, 1990, and the 200-day moving average.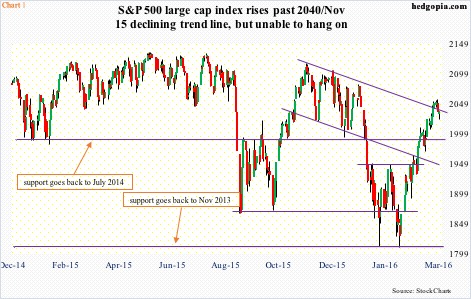
It is currently resting/struggling at 2040 – an important price point, where three different resistance converge: horizontal line going back more than a year, January 2016 gap-down, and November 2015 declining trend line (Chart 1). Besides, at 2017, the 200-DMA lies just underneath.
It is a decision time.
Indeed, monthly Bollinger Band Width on the S&P 500 is at a very narrow 11.5. Bollinger Band Width measures the percentage difference between the upper and lower bands. It drops as Bollinger Bands narrow, indicating decreasing volatility. More often than not, this is followed by a big move.
Which way?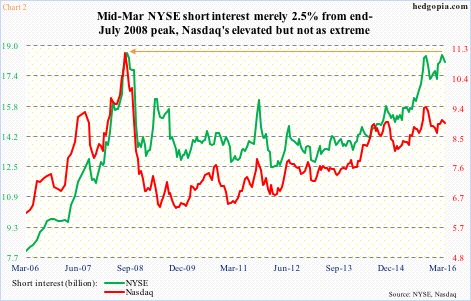
That is the question. If it is to the upside, watch out. Short interest remains elevated. Mid-March, on the NYSE composite, it was a mere 2.5 percent from the end-July 2008 all-time high. A month ago, NYSE short interest rose to 18.5 billion, versus the 18.6 billion peak back then. On the Nasdaq composite, the build-up is not as parabolic, but the trend is similar (Chart 2).
Short squeeze remains a possibility, but what are the catalysts? What is going to cause it? This is a pertinent question particularly considering stocks have already rallied big in the past six weeks. In rallying the S&P 500 north of 13 percent, bulls have expended a lot of buying power. This, even as equity funds are seeing outflows.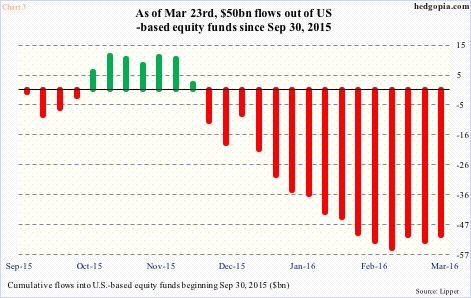
In the week ended Wednesday, $2 billion moved into U.S.-based equity funds – second inflows in three weeks netting $4.5 billion (courtesy of Lipper). Encouraging trend, but probably too little to negate the prevailing negative trend. Since February 10th, $7.9 billion has been redeemed; the S&P 500 bottomed on February 11th. Going back further, since September 30th, these funds have lost north of $50 billion (Chart 3). The S&P 500 bottomed on the 29th that month before rallying 13 percent in five weeks.
Money is available. With the caveat that money market funds do not necessarily have to move into equities when they contract, as of Wednesday last week (as per ICI), they were holding $2.75 trillion (one trillion in retail). At the end of April last year, these funds bottomed at $2.58 trillion, before rising. The S&P 500 peaked in May last year.
Here is the interesting thing. In the past three weeks, money market funds have shrunk by nearly $56 billion. What will it take for owners of these funds to continue on this path and eventually move money into stocks?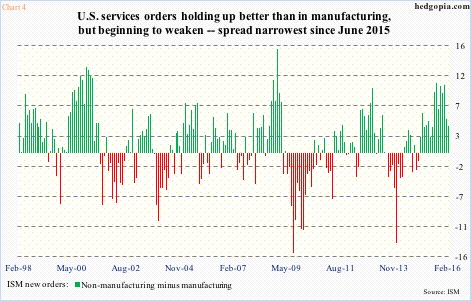
Things will probably have to improve a lot in the way of macro data and corporate profitability. The risk in this scenario is of course a much hawkish Fed and and higher rates. But even here given rates are zero-bound, there is a chance improvement in profitability trumps rate-hike fears.
Let us say ISM manufacturing bottoms out, and orders pick up steam.
First of all, manufacturing has been in contraction mode the past five months through February. Non-manufacturing has been holding up better, but February was 53.4 – a two-year low. Orders are the same way, services performing better than manufacturing. But the spread between the two is narrowing (Chart 4). The February spread of four was the narrowest since June 15.
Let us also assume that a bottom in ISM orders then reverberates through the oil complex, which suffers from both demand slowdown and excess supply. Speaking of which, take a look at Chart 5.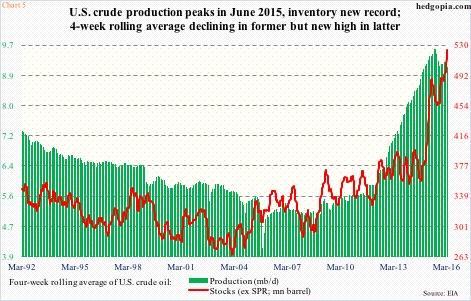
U.S. crude supply continues to rise – to one after another record. In the week ended March 18th, stocks rose another 9.4 million barrels to 532.5 million barrels. In the past 11 weeks, inventory has gone up by 50.2 million barrels!
Chart 5 shows a four-week moving average of U.S. crude production and inventory. In the latest week, the latter made a new high. The former has been in decline. Also in the latest week, production fell by 30,000 barrels per day to nine million b/d. Production reached a record 9.61 mb/d in the June 5th (2015) week.
An increase in economic activity can act as a double whammy – in a positive way. The green bars in Chart 5 are already under pressure, the red line could do the same, improving energy earnings, which have been the biggest negative contributor to deterioration in corporate profits.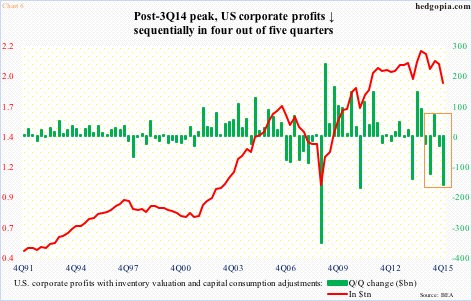
Fourth-quarter corporate profits were just made public last week. Yet another disappointing quarter. Profits adjusted for inventory and capital consumption dropped 7.8 percent sequentially to $1.89 trillion. They peaked at $2.16 trillion in 3Q14, and have had sequential decline in four of the past five quarters (Chart 6). Year-over-year, profits have fallen for two straight quarters – a post-Great Recession first. The trend is not going the right direction.
This is probably why the assumptions in previous paragraphs likely remain just that – assumptions.
With U.S. economic recovery this late in the cycle, it is hard to imagine re-acceleration in activity – enough to matter to profits. In February, the unemployment rate remained unchanged at 4.9 percent, down from 10 percent in October 2009. Capacity utilization has been in decline since cycle high 79 percent in November 2014 (Chart 7).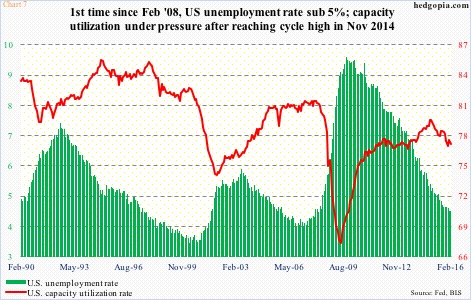
Nothing says the unemployment rate cannot continue going down. It has in the past. Or, for that matter, capacity utilization cannot rise from here. In fact, utilization has not even reached 80 percent in the current cycle.
But if the assumptions above have holes in them – as they seem to have – then it is safe to assume that the current trend continues. The trend in corporate profits, most importantly.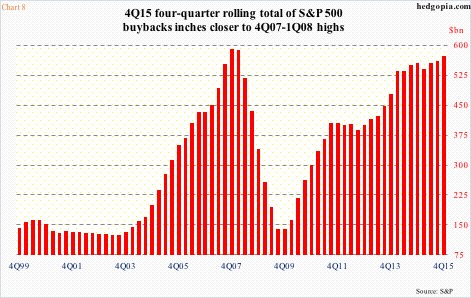
Under this assumption, Chart 8 is very relevant. Buybacks have been the bulwark of the bull market that began in March 2009. S&P 500 companies have so far spent $2.8 trillion, with $2.1 trillion in the past four years.
With $146 billion in 4Q15, buybacks are still going strong, but the rate of change is decelerating, as is evident in Chart 8. And that is a risk facing stocks, given profit deceleration. Good enough reason for the S&P 500 to struggle at resistance?
Thanks for reading!
