
In discussing the dynamics behind the U.S. bond market early this week, an important variable got left out. The chart below plots the budget situation of the U.S. government against issuance by the Treasury of notes and bonds. This gives us a glimpse into the supply dynamics.
From the demand perspective, as the Fed started its QE program in 2009, an upward pressure was created for Treasuries. Theoretically, this should have pushed rates lower. That was the whole idea behind initiating QE anyway. But rates headed the other way. Late 2008, the 10-year yielded a tad over two percent, rose to over four percent by mid-2010, and bottomed at 1.4 percent two years later. Late 2012, the Fed announced that it would begin to buy $45bn/month of Treasuries in addition to the $40bn/month of mortgage-backed securities it had already been purchasing (QE3), but the 10-year kept rising, peaking at just over three percent late 2013. This was when the Fed decided to taper its bond purchases by $10bn/month, to $75bn. The resulting lesser demand for Treasuries should have pushed rates higher, but they headed the other way. Once again, markets proved the conventional wisdom wrong. The point is, the bond market is a complicated creature, with multiple variables doing the pushing and pulling.
From this perspective, whether the U.S. budget deficit is contracting or expanding and how this affects Treasury issuance of new debt is an important variable.
It is relevant to reflect back on the Clinton years.
Back in the late 1990s, the Clinton Administration famously enjoyed a budget surplus – a first since something like 1950. The economy was booming, tax receipts were high, and the stock market was in bubble territory. We all know how it all ended – in tears – but from the perspective of the need to issue debt to fill the budget gap, those were the golden times. More debt was being retired than issued. That changed as the economy slid into recession post-bubble burst. The budget deficit started to rise, reciprocated by a rise in Treasury issuance. (In the accompanying chart, bills are not included, only notes and bonds.)
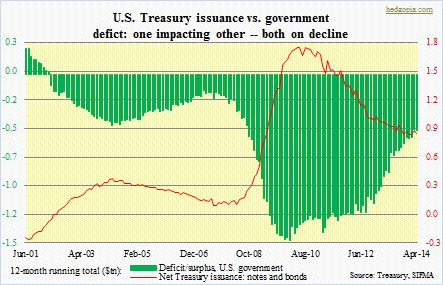 That cycle reared its ugly head even more vehemently post 2007/2008 crisis, with deficit of over $1tn for six consecutive years ended 2013. This was, of course, coincided with aggressive issuance of Treasuries. Then, both peaked. The 12-month running total of U.S. deficit peaked in February 2010 at $1.5tn, followed by peak in Treasury issuance (notes and bonds) of $1.7tn three months afterwards. Currently, the deficit is substantially less versus back then, as is the need to issue debt.
With the taper, the Fed is buying less, but the Treasury is issuing less as well. In the end, this is an important factor in the overall interest-rate equation.
There was a time the Fed accounted for 80-90 percent of what the Treasury was issuing, thus distorting the whole market. If the current pace of the taper is maintained, the Fed will be done toward the end of the year. It is anyone’s guess how this would end up impacting yields on the long end of the curve. The conventional wisdom tells us this should push up yields. If the economy fails to perform as expected – a base-case scenario on this blog – then there will be demand for Treasuries, regardless the Fed stays or exits. And the recent affection for Treasuries perhaps reflects exactly that. Bond traders tend to do a better job than their stock brethren of sniffing out the economy.
