
Say what you want, equity bulls deserve kudos!
There is an unprecedented bid under the market particularly since the election (November 8) last year. The S&P 500 large cap index has nearly rallied 11 percent since! The rubber band keeps stretching. When it snaps, it will do so badly, but until then…
Between now and then, bulls will do their best to extend the already-extended technicals.
As things stand, fundamentals are hardly driving investor/trader sentiment, technicals are.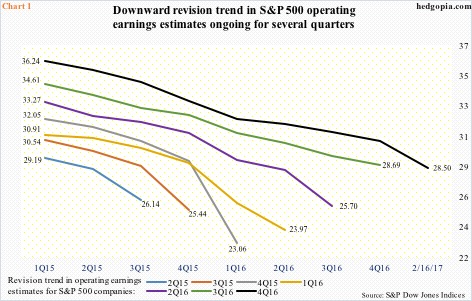
Chart 1 shows the revision trend in operating earnings estimates of S&P 500 companies, going back to 1Q15. All seven quarters are pointing down, meaning estimates are persistently lowered as time passes. In 1Q15, for instance, 4Q16 was expected to earn $36.24, which as of last Thursday was cut down to $28.50; since the quarter ended and through the ongoing earnings season, 4Q estimates went down by nearly $2.
The nearly 11-percent jump in a little over three months does not reflect this, rather post-election elevated optimism regarding economic growth and corporate earnings. The result has been unwavering momentum, and hurried completion of technical targets.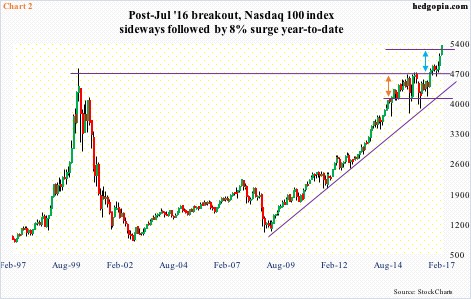
Take the Nasdaq 100 index. Until last July, one-year resistance at 4700 held strong. Down below, 4100 provided support, which could be extended to August 2014 – in fact, goes as far back as 2000. Once a breakout occurred last July, technicians were eyeing 5300, which has already been surpassed, without experiencing even an iota of selling pressure near the measured-move-target resistance (Chart 2).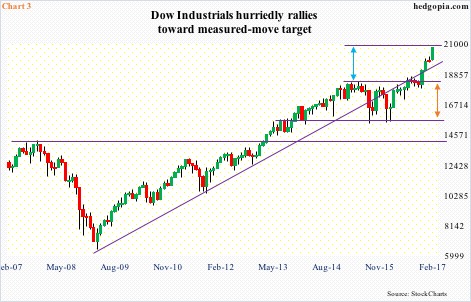
On the Dow Industrials, after six months of providing resistance, 15000 was taken out in November 2013, subsequent to which that level provided support until February last year. In the meantime, bulls were having trouble conquering 18200, which gave away last November, post-election. The resultant measured-move target of 21400 is not that far away (Chart 3).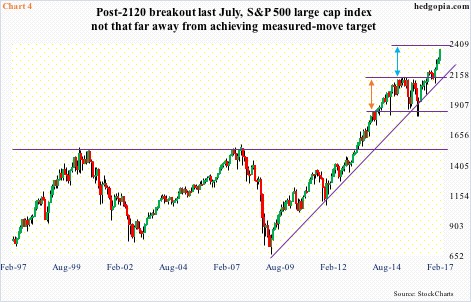
As it happens, the S&P 500 is not an exception in this.
Support at 1800-plus goes back to November 2013. This was successfully tested several times, most prominent of which was in October 2014 and January/February last year. Also in February 2015, the index hit 2119.59 before going sideways to down. That proved to be an important price point, and it was not until July last year that it was taken out. In essence, until that breakout, the S&P 500 was range-bound for nearly a year and a half. This gives a measured-move target of 2420, or thereabouts (Chart 4).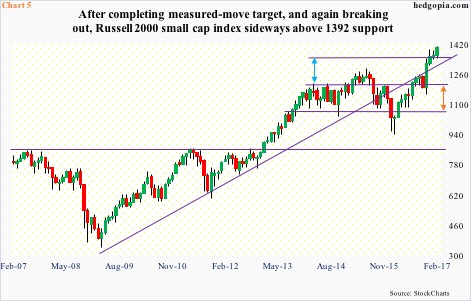
From this respect, the Russell 2000 small cap index one-ups the three other indices. Range-bound between 1082 and 1212 for more than two and a half years, it forcefully broke out – once again – last November. The resultant target of 1342 was met in no time (Chart 5). It then went sideways for a couple of months in a rectangle/flag formation, followed by a break out of the 1347-1392 range. In an ideal technical world, it now has a shot at 1437.
Long story short, bulls have done a good job riding the current momentum, but their biggest test lies ahead. When selling hits – it will – they need to be able to save the rising trend line from 2009 lows. On the Dow and Russell 2000, the trend line was lost and then recaptured, while on the Nasdaq 100 and S&P 500 it is intact. As a matter of fact, on the Nasdaq 100, selling stopped right there in February last year, and on the S&P 500 in November last year – both important lows, hence their significance.
Thanks for reading!
