
Spot gold is at a critical juncture.
Since the metal troughed on December 3rd last year through the March 11th high, it rallied 23 percent. Even before that high, gold had been in a sideways pattern since it spiked 4.1 percent on February 11th (arrow in Chart 1).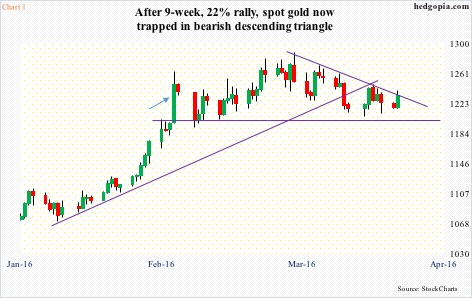
Consequently, spot gold ($1232.9) has been trading within a descending triangle, with the horizontal line at $1200-plus.
Tuesday’s 1.3-percent rally put the metal right on the descending trend line. Unless it is able to break out, the pattern remains very much alive. The next few sessions are important.
Also known as right-angle triangles, and unlike symmetrical triangles which tend to be neutral, descending triangles are bearish patterns indicating distribution.
Where to from here if the pattern is completed?
Just using a measured-move target, spot gold can drop all the way to just below its 200-day moving average ($1140). By that time, it would have not only lost its 50-day moving average but also crucial support at $1180. The latter goes back to November 2009.
What are the odds of a breakdown?
We know this much.
When gold was hammering out a bottom early December last year, GLD, the SPDR gold ETF, was pulling in lots of dough. From December 3rd through March 14th, the ETF attracted $7.8 billion. (March 14th was chosen because that preceded the two-day FOMC meeting.)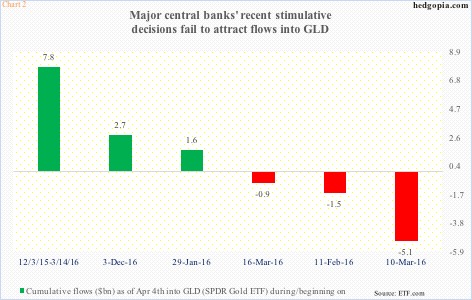
Chart 2 is rather revealing in this respect. From that December 3rd low through April 4th, GLD flows were still positive at $2.7 billion, but nowhere near the early pace.
The chart presents three important dates in terms of gold bugs’ response to central-bank activism: (1) January 29th, when the Bank of Japan deployed negative interest rate policy, (2) March 10th, when the European Central Bank adopted a whole host of stimulus measures, including purchases of corporate bonds, and (3) March 16th, when the Fed switched its message from hawkish to dovish.
One would think these dovish policies would encourage aggressive purchases of the metal. On the contrary. Particularly since both March 10th and 16th, GLD saw outflows (Chart 2).
On March 15th, $4.2 billion left. That was the first of the two-day FOMC meeting. Apparently, money left expecting a hawkish Fed message the following day. (Mid-December last year, when the fed funds rate was raised a quarter point for the first time in nine years, the FOMC expected four more hikes this year.) But in the end the March 16th statement was way dovish. Flows, however, failed to come back. From March 16th through April 4th, the ETF lost $866 million (Chart 2).
This is somewhat similar to what transpired when gold peaked in September 2011. To be fair, it is probably not a fair comparison, nonetheless helps get some perspective.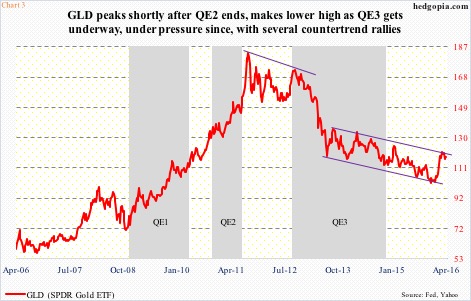
When the yellow metal peaked back then at $1924, the Fed had just ended its second iteration of quantitative easing. Gold headed lower. One year after that peak, QE3 got underway. Gold, however, failed to react positively. It continued lower. In fact, it broke down hard. Logically, QE should have been a tailwind, but was no longer helping (Chart 3 uses GLD, not spot gold). The collective wisdom of market had decided otherwise.
Too soon to say if a similar phenomenon is at work here. Indeed, back in September 2011, gold peaked north of $1900. This time around, it is north of $1200. The metal has already had its share of steep drop.
That said, for an asset class that does not pay a dividend, or interest for that matter, sentiment plays a huge role.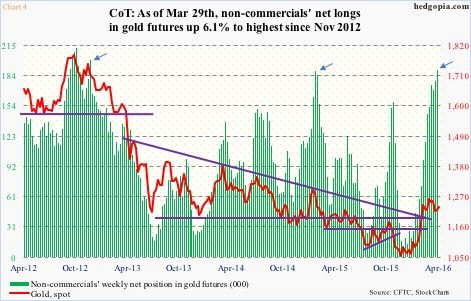
Going by non-commercials’ net longs in gold futures, sentiment is bullish. Too bullish? It is a tough call. The latest tally is comparable to the highs in January last year and September-November in 2012 (arrows in Chart 4). On both occasions, off the highs, net longs began to subside, and gold went along with it.
That is the danger. Net longs currently have gone up from 98,428 on February 9th to 189,806 on March 29th. Gold has essentially gone sideways during the period (Chart 1). If these traders lose patience and begin to unwind holdings, that is when spot gold runs a risk of downside pressure. The descending triangle is worth watching!
The onus is on gold bugs not to let the pattern complete.
Thanks for reading!
