
U.S. banks’ commercial and industrial loans continue to decelerate.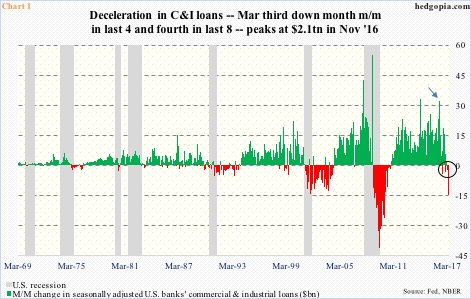
March, out last Friday, came in at a seasonally adjusted annual rate of $2.08 trillion, down $14.7 billion month-over-month. This was the second consecutive m/m decline – and fourth in last eight months (Chart 1).
C&I loans peaked last November at $2.1 trillion, and have been softening since – although ever so slightly. August last year was the first m/m drop since October 2010.
But why are they dropping?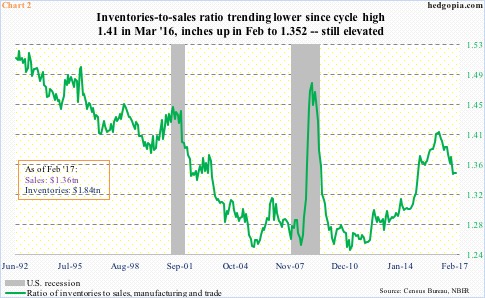
One simple answer is that the business cycle is long in the tooth.
The Great Recession ended June 2009. The subsequent recovery is only a couple of months from completing eight years.
In June 2009, C&I loans were $1.44 trillion, then bottoming at $1.18 trillion in October 2010. From that trough to the November 2016 peak, they jumped 78 percent. For reference, nominal GDP between 2Q09 and 4Q16 increased 31.6 percent.
As growth struggled to meet elevated expectations, inventory accumulated.
The ratio of inventories to sales in manufacturing and trade reached a cycle high 1.41 in March last year. That was also the month C&I loans grew by $32 billion m/m (arrow in Chart 1), before softening. By February, the ratio contracted to 1.35.
There is room for the green line in Chart 2 to continue lower.
In this scenario, the prevailing trend in C&I loans can continue. And this will have repercussions.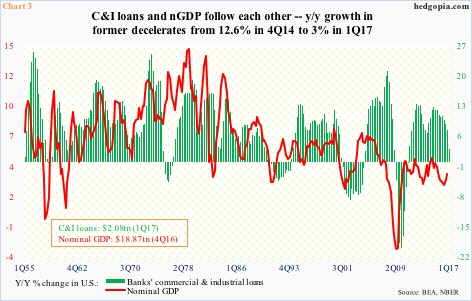
Chart 3 plots year-over-year change in C&I loans against nominal GDP. The two move together. The former decelerated from 12.6 percent in 4Q14 to three percent in 1Q17. GDP followed, except for slight divergence in 2H16.
Arguably, the deceleration in C&I loans has not caught up with GDP, or it is possible this might get reflected in 1Q17 GDP.
The advance estimate of 1Q17 GDP is due out on the 28th. As of Tuesday, the Atlanta Fed’s GDPNow model forecasts 0.5-percent growth in real GDP. The economy expanded 2.1 percent in 4Q16.
On the right side of Chart 1, red bars are just beginning to show up. In the past, they popped up here and there in the midst of expansion. But the longer they persist, the risk of a grey bar grows.
Worth watching.
Thanks for reading!
