
Corporate bond issuance in May surged 74.5 percent month-over-month and 15.6 percent year-over-year to $205.8 billion. Of this, investment-grade was $177.1 billion and high-yield $28.7 billion. IG jumped 105.6 percent m/m and 21.8 percent y/y, while HY was down 9.8 percent m/m and down 12.3 percent y/y.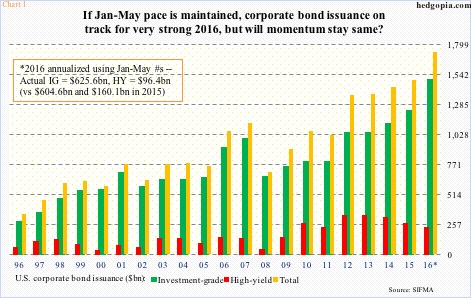
As is obvious, HY is taking it on the chin. Chart 1 plots annual issuance going back to 1996, with 2016 using annualized numbers for January-May. On this basis, 2016 is on course for massive $1.7-trillion, with IG at $1.5 trillion and HY at $231 billion (Chart 1).
If this pace is maintained – big if – this probably bodes well for corporate buybacks.
Howard Silverblatt, of S&P, yesterday released the final tally of S&P 500 buybacks for 1Q16. One cannot help but get impressed. S&P 500 companies spent $161.4 billion in the quarter – second only to a record $172 billion in 3Q07. The 1Q16 total was up 10.6 percent q/q and up 12 percent y/y. The S&P 500 only managed to rise 0.8 percent in the quarter, by the way.
On a four-quarter rolling total basis, 1Q16 buybacks were $589.4 billion, up three percent sequentially and up 9.5 percent annually. This was a new record, barely squeaking by the prior high of $589.11 billion in 4Q07 (Chart 2).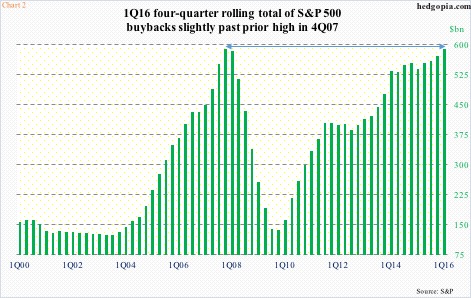
But what might the second half bring?
Here are a few thoughts on this.
First, although annualizing the first five months puts 2016 issuance much higher than 2015, the five-month total this year is smaller than last year – $722 billion versus $764.7 billion. This is due to shrinkage in high-yield issuance, which decelerated from $160.1 billion in the first five months last year to $96.4 billion this year. IG is doing fine – $604.6 billion last year versus $625.6 billion this year.
So when it is all said and done, 2016 may not turn out to be as strong as implied by annualizing the first five months.
If so, this can reverberate through buybacks.
Second, along with $161.4 billion in buybacks, S&P 500 companies paid $96.26 billion in dividends in 1Q16, for a combined total of $257.65 billion. This is much bigger than $208.99 billion in operating earnings during the quarter. In other words, these companies are biting off more than they can chew. And this is not the first time. In fact, 1Q16 is the third quarter in succession that buybacks and dividends combined exceeded operating earnings – and four out of the last five. This is not sustainable. Something has to give. Either operating earnings increase meaningfully going forward – not a base case on this blog – or buybacks and dividends get cut.
Corporations have been relying on debt issuance for buybacks in particular. Hence the significance of Chart 1, and how the second half turns out.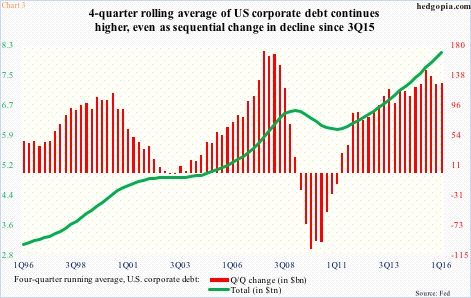
Third, as of 1Q16, non-financial corporate debt was $8.3 trillion. Chart 3 uses a four-quarter running average, with 1Q16 at $8.1 trillion. The green line’s momentum is clearly up. That said, quarter-over-quarter change peaked in 2Q15, and has decelerated since. Once again, in due course, this can be an important metric as far as potential impact on Chart 2 is concerned.
Debt has played an important role in sustaining the buyback momentum. At some point, it will begin to fall under its own weight. We may very well be witnessing early signs of this.
Thanks for reading!
