
U.S. corporate profits adjusted for inventory and depreciation in 3Q16 grew the most quarter-over-quarter since 2Q14. They rose 6.6 percent to a seasonally adjusted annual rate of $2.15 trillion, breaking five consecutive quarters of year-over-year decline (Chart 4). Profits peaked at $2.2 trillion in 4Q14.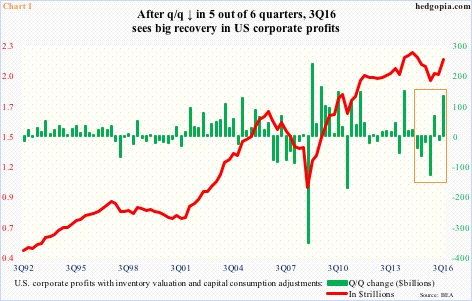
Since that peak until 2Q16, profits declined sequentially in five of the six quarters (box in Chart 1). From this respect, 3Q16 is a breath of fresh air. The consensus expects things to get a lot better next year, and 3Q16 may very well be a quarter in which the prevailing trend has shifted.
How probable is this scenario?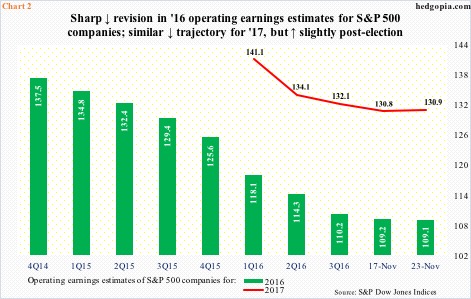
Next year’s earnings estimates have plenty of optimism built in already. Nothing new. For at least the last several years, it has been customary for the sell-side to start out optimistic, and then revise estimates down as time passes.
Take 2015, for example. In 2Q14, S&P 500 companies were expected to earn $137.50 in operating earnings, but the year ended up earning $100.45. Or 2016, for that matter. In February last year, it was expected to bring in $137.50, which has now been revised downward to $109.10 (Chart 2).
Not surprisingly, 2017 in the middle of January this year started out at $141.11, before coming under pressure. At $130.90, it will still register growth of 20 percent over 2016 if these estimates come through.
Here is the rub.
President-elect Donald Trump’s emphasis on lower taxes, infrastructure spending and less regulations have revived growth hopes for the economy.
In fact, on November 9, operating earnings estimates for 2017 stood at $131; eight days later, this was cut down to $130.84. Six more days (as of November 23), and they got revised upward by 10 cents, to $130.94. It is possible the Trump effect is being modeled in.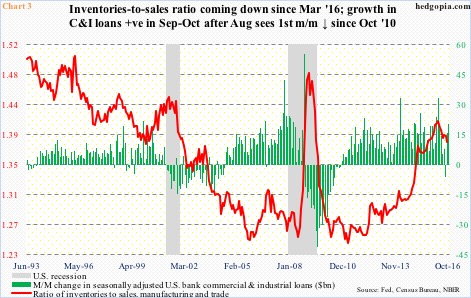
Through public-private partnerships and through tax breaks, Mr. Trump wants to invest $1 trillion in infrastructure over 10 years.
First of all, a smooth passage is anything but certain in Congress. Second, even if Congress gives the go-ahead, the economy may not feel its impact until at least 2018. These things take time. And last but not the least, we are talking $100 billion/year in a $19-trillion economy. Of course, its impact will be larger due to the multiplier effect, but in a leveraged economy in which federal debt is nearly $20 trillion (plus another $3 trillion on a state and local level), the multiplier effect will remain subdued.
Particularly when inventory remains above average.
In 3Q16, real GDP grew 3.2 percent, 0.49 percent of which was contributed by inventory build. True, this came on the heels of five straight quarters of negative contribution, but, in the face of challenging sales, inventory remains elevated.
In September, the inventory-to-sales ratio in manufacturing and trade was 1.383, lower than the 1.412 cycle high in March this year, but way elevated (Chart 3). In the meantime, banks’ commercial & industrial loans in September and October went up by $36 billion, and at least a good chunk of this probably goes toward inventory build.
Point is, it is too early to expect much stronger growth next year. Real GDP expanded at 2.4 percent in 2015. This year, it is tracking at below two percent. The consensus is at 2.2 percent for next year.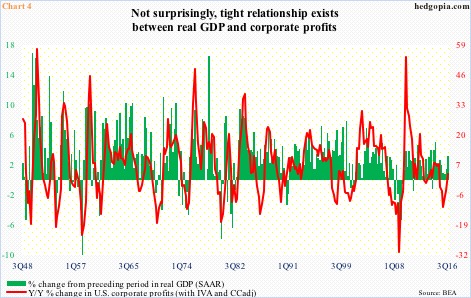
Not surprisingly, there is a close relationship between GDP and corporate profits (Chart 4). The spike in profits in 3Q16 coincided with a 3.2-percent growth in real GDP. For S&P 500 companies to realize the currently expected $130.94 next year, the economy needs to perform much better next year – not a given, especially when the dollar is as strong as it is.
The bottom line: 2017 estimates for S&P 500 companies have come down but still look elevated.
Thanks for reading!
