The following are futures positions of non-commercials as of September 29, 2015. Change is week-over-week.
10-year note: Hat tip to bond vigilantes! Heading into the FOMC meeting two weeks ago, they never bought into the message coming out of the shorter end of the yield curve. Since then, the two-year yield has given back 24 basis points, even as TLT, the iShares 20+ Year Treasury ETF, has rallied six-plus percent. The jobs report yesterday was as good a vindication as any they could possibly get.
It is not too often the 10-year Treasury yield sheds 13 basis points in a single session, which was the case at one point post-jobs report yesterday – an indication that even the vigilantes were not expecting the kind of payroll deterioration that September witnessed. There is serious deceleration in non-farm momentum, with four out of the last seven months sub-200,000 and the nine-month average this year of 198,000 well below the 2014 average of 260,000. The odds of a hike in October? Zero. Next in line of fire? Probably December.
In a little over two weeks since the FOMC meeting, the 10-year yield shrunk by 40 basis points. Too soon, too fast? Probably. Near-term, TLT looks like a short – was not able to keep all of its daily gains on Friday.
Non-commercials disagree. They went net long after remaining net short the prior four weeks.
Currently net long 22.5k, up 31k.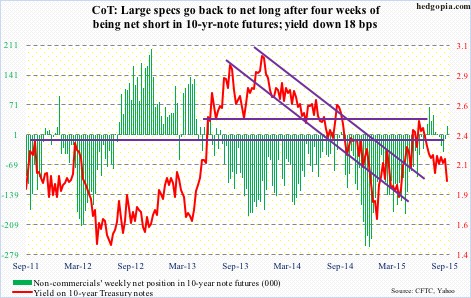
30-year bond: Next week’s major economic releases are as follows, and it is relatively light.
Monday, we get the ISM non-manufacturing index for September. This Thursday, manufacturing PMI was disappointing – to say the least. The main index dropped from 51.1 in August to 50.2, reaching the lowest since 50 in May 2013. Similarly, new orders dropped from 51.7 to 50.1 – the lowest since 49.6 in May 2013. On the non-manufacturing side, however, things do not look as dire. The main index was 59 in August, and new orders 63.4.
Thursday, FOMC minutes for the September 16th-17th meeting come out. Post-meeting, this is what we learned. Four FOMC members do not expect economic conditions to warrant a liftoff until next year or later. One member predicts the fed funds rate will go negative this year and next.
Since that meeting, however, there has been a decidedly hawkish bent in speeches of several FOMC members. What changed? Not a whole lot on the data front. But stocks did sell off post-FOMC decision not to hike. So they are probably thinking markets are begging for them to move. We simply don’t know if that is the case. Not until they make a move. Once that happens – whenever that is – how markets react will have immense implications across asset classes as well as volatility.
We also get international trade (Tuesday), consumer credit (Wednesday) and import and export prices (Friday).
Three FOMC members are on tap to speak, with John Williams, president of the San Francisco Fed, scheduled to speak twice. Also this week he delivered two speeches, and sees interest rates going up this year, perhaps as early as October. He said the decision to hold off on raising rates at last month’s meeting was “a very close call.” “I would view October to be a completely live meeting.” It will be interesting to see if he will voice the same opinion after this week’s ISM report as well as the jobs report. Probably not.
Currently net short 9.1k, down 16.7k.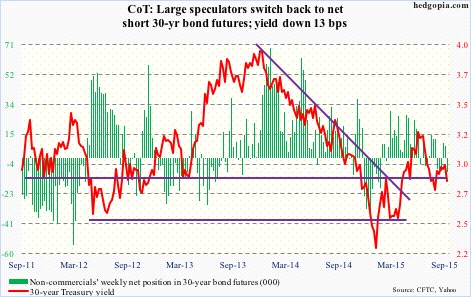
Crude oil: The week produced a mismatch of good and bad.
Crude inventory was up four million barrels in the week ended September 25, to 457.9 million barrels (up 101.3 million barrels year-over-year, by the way!). Gasoline stocks rose 3.3 million barrels, to 222 million barrels (up nine-plus million barrels in the past six weeks). Refinery utilization fell 1.1 percentage point to 89.8 – the first sub-90 reading since March this year. But Cushing saw a drawdown of a million barrel. And crude production fell by 40,000 barrels a day, to 9.1 million barrels per day. Production peaked at 9.61 mb/d in the June 5th week. Further, in the week ended October 2, oil rigs went down by 26, to 614 – the least since August 2010. The all-time high was 1,609 in October last year.
If not for Friday, spot WTI would have been down for the week – was up 1.4 percent in the session. The Wednesday news of Russian airstrikes in Syria was no help to oil.
The Friday action is encouraging as once again buyers showed up to defend the 43-44 support. With that said, the 13-week exponential moving average, which is still pointing lower, once again proved tough to crack. This was the third straight week and four out of the last five that this average repelled a rally attempt. There are now three back-to-back weekly dojis. A break is coming – either up or down.
Non-commercials slightly cut back, but do have sizable positions.
Currently net long 283.2k, down 12.6k.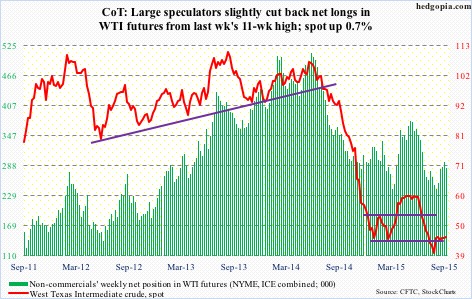
E-mini S&P 500: Investors Intelligence bulls’ count slid further this week, to 24.7 percent – the lowest since December 2008 (23.1). Bears, too, jumped 4.9 points to 35.1, but their ranks can go a lot higher if the correction camp, stuck in the 40s for the last nine weeks, give up and turn negative. But would they? If they have hung in thus far, during which the S&P 500 index gave back 12.5 percent, odds favor the status quo continues. If anything, they might even begin to lean bullish – at least near-term. Earnings season and seasonality are two potential catalysts.
Speaking of seasonality, Goldman Sachs points out that based on averages for 2007 and 2009-1014 November is the busiest month of the year for buybacks among S&P 500 companies, and that the fourth quarter is the busiest quarter, accounting for 30 percent of buybacks. Let us hope the streak continues this year. Corporate buybacks have been a reliable source of buying power. Else, the dark clouds hovering overhead will begin to take over. For the first time in four years, September saw the S&P 500 close below its 20-month exponential moving average. This is a potential worry long-term.
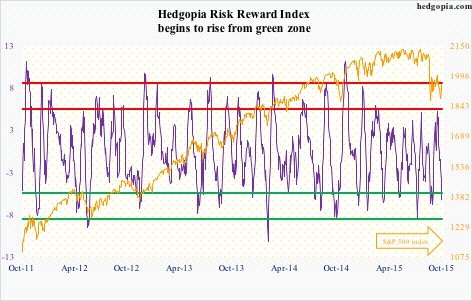
Near-term, the path of least resistance is up – also suggested by the Hedgopia Risk Reward Index. The Friday reversal needs the benefit of the doubt, especially having come amidst the prevailing gloomy sentiment.
Currently net short 283.2k, down 12.6k.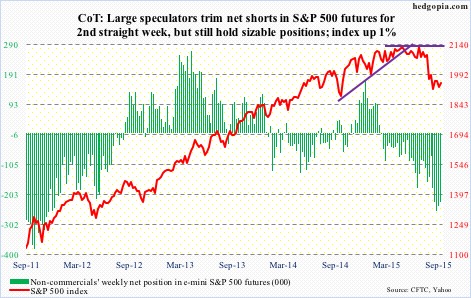
Euro: In September, for the first time in six months the euro area’s inflation rate turned negative – down 0.1 percent. Totally unexpected! The currency reacted by dropping 0.7 percent on Wednesday. Earlier on Monday it completely ignored Spain’s election results, as buyers snapped up intra-day weakness near the 50-day moving average. That average continues to move up, and a golden cross is just around the corner, with a mere 0.30 separating the two averages. The technical picture improves if the euro can get over 114.40ish. Having said that, it was unable to hang on to Friday’s gains (rose as high as 113.19, before closing at 112.1).
Non-commercials continue to lean bearish, though not to the extent they were early this year.
Currently net short 87.7k, up 6.6k.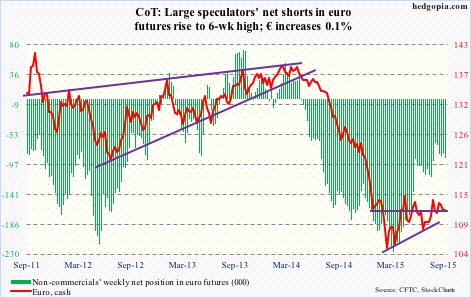
Gold: The metal had a lackluster week – until Friday, that is. In the first four sessions, it was down 2.9 percent. Then came the jobs report. The metal got bid up – hard – rallying 2.2 percent and retaking the 50-day moving average. With this, it is once again banging at the 1,140 resistance, which goes back 11 months. That average is beginning to curl up, by the way. There is room for gold to move higher on a weekly chart. A break of that resistance will be a major victory for gold bugs. Fingers crossed!
Non-commercials have been actively adding to net longs – up 94 percent in two weeks.
Currently net long 76.6k, up 15.5k.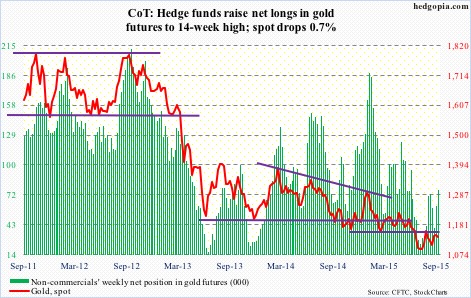
Nasdaq 100 index (mini): On Wednesday, the Nasdaq 100 suffered a death cross, with the Nasdaq composite doing the same two days earlier. These two indices have taken their time to join the bandwagon. The pattern developed on the S&P 500, the Dow Industrials and the Russell 2000 much earlier. Not sure what to make of it. By the time it showed up on the Nasdaq composite, the index had already lost 13-plus percent. In fact, between the July 20th high of 5232 and the August 24th low of 4292, it lost 18 percent. Rather too late for any signal to meaningfully matter? Too soon to tell, but in the near-term, these indices are itching to move higher, with bio-techs beginning to attract bids. Semis act well. Incidentally on both IBB, the iShares Nasdaq Biotech ETF, and XBI, the SPDR S&P Biotech ETF, volume this Monday was much higher than on August 24, raising the odds of a washout near-term.
On the Nasdaq 100, resistance is solid at 4350, which is just under two percent away. Game changes if that resistance gets taken down.
Currently net long 2k, down 7k.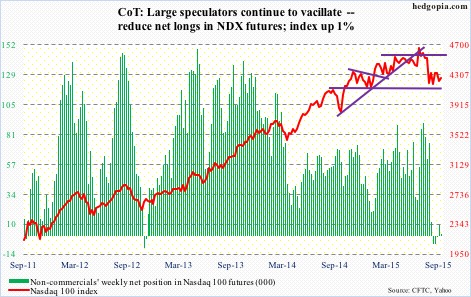
Russell 2000 mini-index: Just so we are not oblivious to the tough macro environment and get overly bulled up, here is a little reminder from Fitch Ratings. It said the trailing 12-month leveraged loan default rate inched up to 1.5 percent in August, up from 1.4 percent for much of this year, further adding that it could near two percent this fall. Worryingly, many of the recent loan defaults did not come from the energy, metals or mining sectors.
On Friday, as did other major U.S. indices, the Russell 2000 had an impressive intra-day reversal. RVX, the Russell 2000 Volatility Index, is literally sitting on its 50-day moving average and is likely headed toward the 200-day moving average, which is nearly four points lower.
Currently net short 29k, up 1.2k.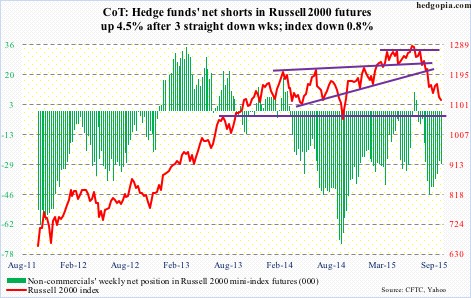
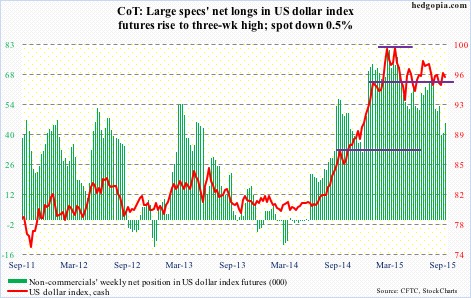
US Dollar Index: For the eight sessions ended Thursday, the dollar index was literally sitting right underneath its 50- and 150-day moving averages. Then came Friday’s jobs report, which led to a dramatic shift in the fed funds futures curve. Interest rates across the yield curve took it on the chin. The dollar reacted, dropping 0.4 percent for the session (was down 1.1 percent at one time). If there is any consolation for dollar bulls, it is that the 200-day moving average was not violated. So it continues to remain trapped between 50- and 200-day moving averages.
Non-commercials do not fancy the buck any more. Scratch that. They still do, but not to the extent they did back in March.
Currently net long 45.7k, up 4.9k.
VIX: Non-commercials have stayed net long for six straight weeks, during which spot VIX contracted by north of seven points. With that said, in the very first week they went net long, the spot did spike to 53.29 (August 24th) before reversing.
The spot is literally sitting on the 50-day moving average. Equity bulls would have scored a major victory – at least near-term – if they can push the spot below that average, which looks likely.
Currently net long 30.2k, up 5.4k.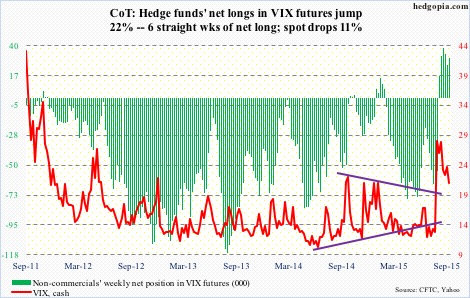
Hedgopia Risk Reward Index