The following are futures positions of non-commercials as of November 24, 2015. Change is week-over-week. (Due to Thanksgiving last week, the CFTC released numbers on Monday, instead of last Friday.)
10-year note: Chances of the Fed moving next month (FOMC meeting on December 15-16) have risen to 78 percent. That is what fed funds futures are predicting.
At the same time, the two-year yield, which tends to be the most sensitive to Fed policy, has risen to 0.94 percent – the highest since May 2010… was 0.57 percent as early as October 14th.
The fly in the ointment? The long end of the yield curve is not as enthusiastic as the short end about what is looking like an imminent hike in the middle of December. The curve is flattening.
The 10-year does not seem convinced of the prevailing argument that the Fed wants to raise rates because of strong macro data.
Non-commercials went net long for the first time in six weeks.
Seen in this light, the Fed may be indifferent to November’s payroll numbers, due out this Friday, unless the data is extremely weak.
Currently net long 35.1k, up 83.2k.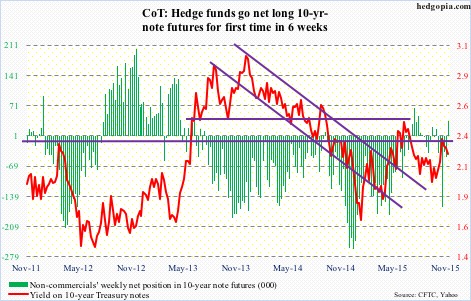
30-year bond: This week’s major economic releases are as follows.
October’s pending home sales index was published yesterday, coming in at 107.7, versus upwardly revised 107.5 in September. The index peaked at 112.3 in May this year – the highest since 112.5 in May 2006 – and correlates well with sales of existing homes. The latter dropped to a seasonally adjusted annual rate of 5.36 million units in October, down from 5.55 million in September; July saw a high of 5.58 million – the highest since 5.79 million in February 2007.
Today, we get the ISM manufacturing index for November. The October reading of 50.1 was barely in expansion territory – the lowest since 50 in May 2013. The orders component, however, rose from 50.1 in September to 52.9.
The ISM non-manufacturing index comes out on Thursday, and it is faring much better than manufacturing. In October, the main index rose from 56.9 to 59.1, and orders from 56.7 to 62.
On Wednesday, the Beige Book is released, as well as revised productivity numbers for the third quarter. Non-farm output per hour rose a mere 0.4 percent year-over-year in the quarter, and is struggling to gain traction.
The advance report on durable goods for October was released two weeks ago. Revised estimates, as well as non-durable goods data, will be published on Thursday. This series has been posting weak numbers for several months now, with preliminary estimates for October showing a slight uptick. Orders for non-defense capital goods ex-aircraft rose 0.4 percent year-over-year – the first increase in nine months.
Friday, we get November’s employment report. October was a surprise. Having added sub-200,000 non-farm jobs in August and September, the month produced 271,000. That said, momentum is in deceleration, with 2014 having averaged 206,000, versus 260,000 in 2014. As well, the average hourly earnings of private-sector employees grew 2.5 percent year-over-year – the first such increase since July 2009.
Currently net short 21.9k, up 1.2k.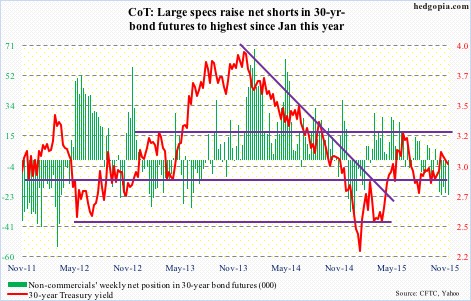
Crude oil: The black gold began to move as soon as trading opened last Monday. Come Tuesday, Turkey downs a Russian jet. Oil was handed additional tailwind.
Spot West Texas Intermediate crude rallied 0.8 percent in the week, more or less ignoring the EIA data that had more negatives than positives.
For the week ended November 20th, stocks rose across the board.
Crude stocks increased 961,000 barrels, to 488.2 million barrels. This was the ninth straight weekly increase, with stocks at the highest since the April 24th week… Gasoline stocks rose 2.5 million barrels, to 216.7 million barrels… Distillate stocks rose 1.05 million barrels, to 141.4 million barrels. The prior week was at a 19-week low.
Crude imports rose 365,000 barrels a day, to 7.3 mbpd, essentially offsetting the decline in the prior week.
In contrast, crude production fell by 17,000 barrels per day, to 9.17 million barrels per day. Production peaked at 9.61 mbpd in the June 5th week… Refinery utilization rose further – up 1.7 percentage points to 92 percent. It has now risen for six straight weeks, from 86 percent in the October 9th week. Utilization peaked at 96.1 percent in the August 7th week.
Non-commercials have now reduced net longs to the lowest since December 2012.
Currently net long 218.7k, down 42.1k.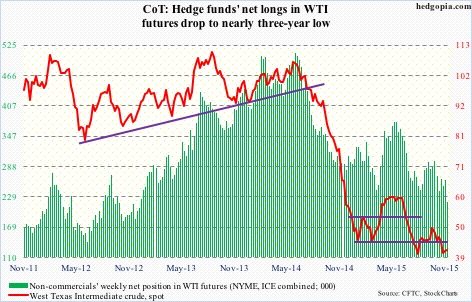
E-mini S&P 500: As of the 24th, with 489 of S&P 500 companies reporting, 3Q15 operating earnings estimates stood at $25.48; last year was $29.60.
With one month to go, at $106.68, estimates for the year are still inching lower. At the end of the second quarter last year, 2015 estimates were $137.50. This year, operating earnings are on track to dropping 5.6 percent from last year’s $113.02.
S&P points out that ex-energy, earnings would be up 6.1 percent this year. This is a nice statistic to look at, but does not help much – the same way it would not help if we excluded tech/telecom in 2000-2001 and financials in 2007-2008.
As important a sector as energy is, the decline in earnings matters, as repercussions are felt widely, ranging from company bankruptcies to reduction in capital expenditures to layoffs. This is more of a rearview mirror.
Looking through the windshield, 2016 earnings become a focal point. Expectations are lofty – $126.54. These estimates have come down from $137.50 at the end of 2014, but if realized they would have grown nearly 19 percent over 2015… Which would be the fastest growth since 2010. Quite a feat, if realized. For this to happen, both oil and the dollar need to reverse, with the former rallying and the latter retreating.
Non-commercials continue to cut back net shorts – now sub-100,000 contracts – and that has helped stocks.
Currently net short 98.1k, down 27.7k.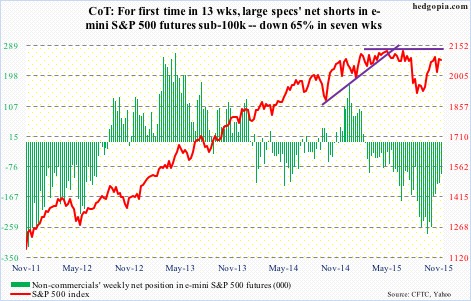
Euro: Will Mario Draghi, ECB president, deliver on December 3rd? Markets are bracing for something big. Mr. Draghi himself has hinted for a while that the bank would announce something this Thursday.
The question is not if he would oblige. He will. He will have to. He has suggested as much. The question is how markets will perceive whatever is announced. If the governing council just ends up cutting the deposit rate – already negative – and not extend the existing stimulus program, which runs through next September, odds are decent the euro rallies.
The currency is looking for a reason to move higher.
Alternatively, even if the ECB intends to eventually announce something big, it is possible it holds off until the January meeting.
Mr. Draghi does have a first-mover advantage over the Fed in that he has the discretion to wait until the Fed moves – or not – and save the big bazooka, if at all, until the January meeting. Keep the powder dry, so to speak.
It will be interesting to find out how the euro reacts in this scenario. The currency remains extremely oversold on a daily chart in particular, and is itching to reverse direction, at least in the near term.
Currently net short 175.5k, up 11.3k.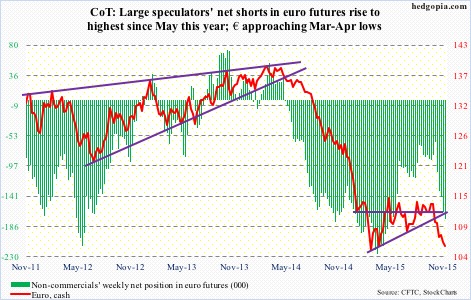
Gold: It is hard to put the finger on just exactly what gold is trading on these days.
The yellow metal peaked in September 2011 right after QE2 (U.S.) ended, and continued lower even after QE3 got underway.
Now we are in the midst of QE in both the Eurozone and Japan. Gold does not care.
Turkey downs a Russian jet. Gold does not care.
The metal reaches an important technical level, and gold – or gold bugs – do not care. At 1,089, the spot retraced 50 percent of the July 1999-September 2011 surge, but buyers did not step up to defend that support. Gold is $25 below that level.
Spot gold’s daily chart in particular shows how oversold the metal is, but gold does not care. Before last Friday’s 1.3-percent drop, it was beginning to look like gold was trying to stabilize. Now the 1,070-1,080 region can act as resistance.
In the meantime, non-commercials’ net longs have dropped to the lowest since February 2005. Back then, net longs began to rise after bottoming at 11.2k contracts.
Currently net long 16.3k, down 18.1k.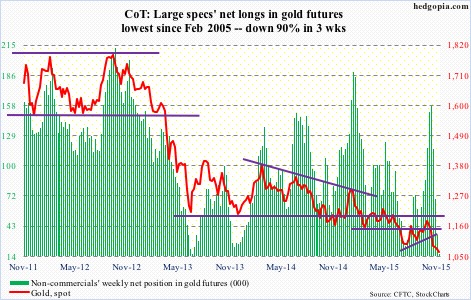
Nasdaq 100 index (mini): Last week, the index was essentially flat, down 0.1 percent. Not bad given four of the top-five weights were down – AAPL down 1.3 percent, AMZN up 0.7 percent, FB down 1.7 percent, MSFT down 0.5 percent, and GOOGL down 0.7 percent.
That said, in general the rally since the September 29th low has been led by large-caps – hardly healthy in a larger scheme of things.
Flows have been a suspect all along. Sine that low, a total of $11.7 billion has flown into U.S.-based equity funds (courtesy of Lipper) – decent but not great, given how powerful the rally has been. In the week ended last Wednesday, inflows were $2.9 billion, essentially offsetting the outflows of the prior two weeks.
Currently net long 55.2k, down 13.6k.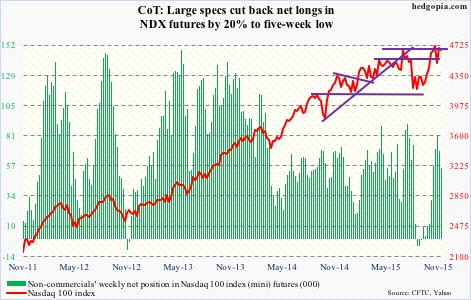
Russell 2000 mini-index: The moment of truth is upon small-cap bulls.
By last Friday, the Russell 2000 rallied nearly five percent in the last nine sessions, and with this is once again testing a make-or-break resistance. The 1210-1215 range has proven to be an important level going back to March last year.
After the August rout, that resistance was tested twice – one in the middle of September and the other early last month. Both failed. So a lot is riding on this attempt.
On a weekly chart, there is room for the index to move higher still. Daily conditions are beginning to get extended though. And the 200-day moving average is right above. The last time the Russell 2000 was above that average was on August 17th, right before the seven-day, 10-percent drop.
So it is hard to imagine a convincing breakout. Yesterday, IWM, the iShares Russell 2000 ETF, was rejected by its 200-day moving average.
Non-commercials continue not to buy the small-cap story.
Currently net short 41.5k, down 3.8k.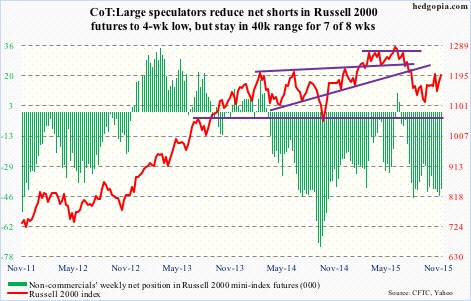
US Dollar Index: U.S. multinationals are an unhappy bunch. They must be hoping the dollar index does not stage a breakout.
Back in March this year, it retreated after nearly retracing 61.8 percent of the July 2001-April 2008 decline. After a nearly seven-percent rally the past six weeks, the dollar index is back at the March highs. A convincing breakout here will be massive – and a nightmare for U.S. exports.
That said, at least in the near term, the greenback is probably setting up for unwinding the overbought conditions it is in. Secondly, it has rallied primarily because of market expectations that the Fed would hike in two weeks’ time, and could very well be a victim of the ‘buy the rumor, sell the news’ phenomenon.
Non-commercials have never looked as enthusiastic as they were when the dollar index was trading at a similar level back in March/April. And for the first time in five weeks, they reduced net longs.
Currently net long 46.1k, down 381.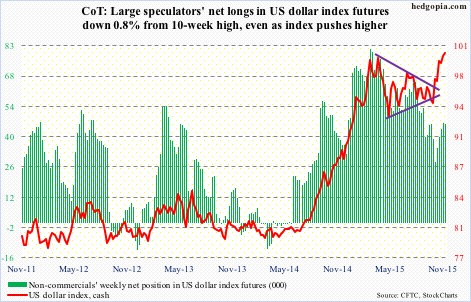
VIX: For the past six sessions, spot VIX has been vacillating around its 200-day moving average. Yesterday, it rallied nearly seven percent to close right underneath that, and could be setting up for further strength.
Currently net short 7k, down 3.9k.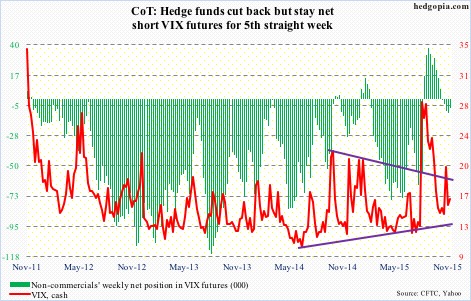
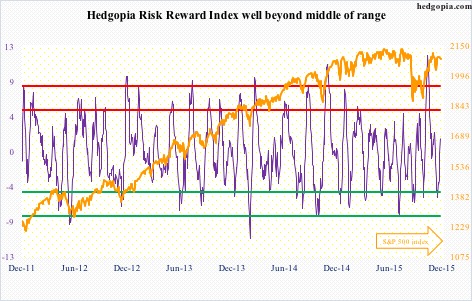
Hedgopia Risk Reward Index