The following are futures positions of non-commercials as of July 28, 2015. Change is week-over-week.
10-year note: The following from the FOMC statement drew a lot of attention: “The Committee anticipates that it will be appropriate to raise the target range for the federal funds rate when it has seen some further improvement in the labor market and is reasonably confident that inflation will move back to its 2 percent objective over the medium term.”
Investors are keying in on that word “some”, which has been added in this week’s meeting.
How much improvement in the labor market will be viewed as “improvement” to qualify for “some”? Of late, U.S. jobs momentum has been on the wane. In two of the last four months, non-farm jobs have been sub-200,000, with the monthly average in the first half of 208,000. In the past two months the six-month average has crossed below the 12-month average (245,000). In 2014 the monthly average was 260,000.
“Some” is vague as can be.
There are three more meetings left this year for the FOMC to act. The next one is on September 16-17, with a press conference scheduled for Chair Janet Yellen. If they really want to move, it will be either this meeting or the one on December 15-16, which also has a press conference scheduled. August and September 4 have now taken on added importance. That is when the jobs report for July and August will be reported.
Yesterday, the employment cost index came up short. Wages and salaries grew a mere 0.2 percent sequentially in the second quarter – the smallest pace since records began in 1982; year-over-year, growth slowed to 2.1 percent from 2.6 percent in 1Q.
Early in the week, bonds ignored the weak durable goods report, as well as pending home sales, but rallied on GDP and ECI. Real GDP grew 2.3 percent in the second quarter – less than expected.
TLT, the iShares 20+ Year Treasury Bond ETF, rallied 1.5 percent the past couple of sessions. Bond vigilantes beginning to bet September is off the table?
For the second straight week, non-commercials are net long, taking holdings to the highest since April 2013.
Currently net long 65.6k, up 38.2k.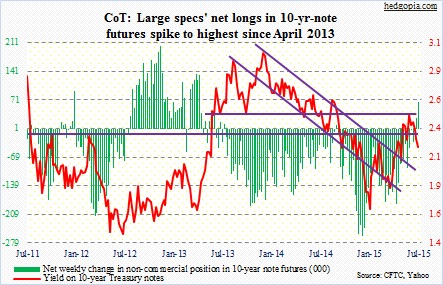
30-year bond: Here are the major economic releases next week.
Personal income for June will be released on Monday. One of the things investors will be keying in on is the PCE deflator, the Fed’s favorite gauge of inflation. In May, PCE and core PCE year-over-year grew 0.2 percent and 1.2 percent, respectively. The last time core PCE rose two percent was April 2012.
Also on Monday, the ISM manufacturing index is published, followed by its non-manufacturing cousin on Wednesday. In the past year, manufacturing has vacillated within a range of 58.1 and 51.5, while non-manufacturing, between 58.6 and 55.7, has been less volatile.
The advance report on durable goods for June came out this week. Revised and more detailed estimates, combined with nondurable goods, will be out Tuesday. Since they peaked at $74 billion last September, orders for non-defense capital goods ex-aircraft – proxy for business capital expenditures – have lost momentum; year-over-year, they have fallen five straight months. The GDP report lent credence to this, as real non-residential fixed investment fell 0.6 percent in 2Q15 – first shrinkage since 3Q12.
July’s employment report is slated for Friday. As explained earlier, jobs momentum has softened of late. This probably does not bode well for the much-hoped-for wage acceleration. In June, average hourly earnings for private-sector employees grew two percent year-over-year, and is yet to grow with a three handle in the current recovery.
One Fed official is scheduled to speak.
Currently net long 1.2k, up 6.4k.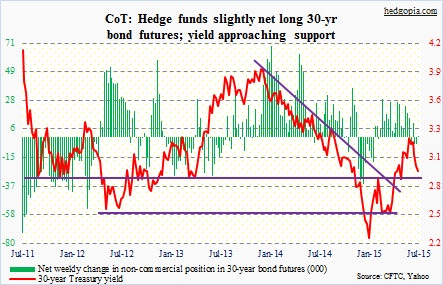
Crude oil: U.S. inventories fell by 4.2 million barrels during the July 24th week, to 459.7 million barrels, versus expectations for a decline of 184,000 barrels. Stocks peaked at 490.9 million barrels in the April 24th week. With that said, the average in the past year was 419.3 million barrels, and even lower before that. Inventories remain high.
Crude oil, grossly oversold on a daily chart, was looking for a reason to rally. The inventory data helped. As well, stocks at Cushing, OK, fell by 212,000 barrels. Gasoline stocks fell, too – by 363,000 barrels. By Thursday, spot WTI was up one percent. Friday, it was slammed hard – down 3.5 percent. U.S. oil rigs rose by five to 664.
The WTI is trying hard to stabilize around here. But the question is, can it build on it? Shorter-term moving averages are still dropping. If – big if – it rallies, 51 offers resistance. It lost that level in the middle of the month.
Non-commercials continued to cut net longs – to a 17-week low.
Currently net long 259.1k, down 5.5k.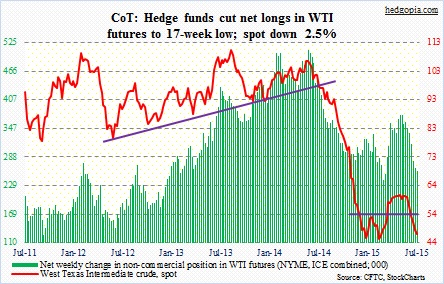
E-mini S&P 500: Markets continue to churn. The buy-write strategy must be doing very well. For the week, the 200-day moving average held – once again. This was the third test this year – on the heels of one in February and one early this month. The subsequent rally must have squeezed the shorts. Mid-July SPY short interest was 346 million, up 16 percent period-over-period and 59 percent in six months.
The May high (2134.72) is a stone’s throw away. A breakout can cause a bigger squeeze. With that said, that level has already rejected rally attempts twice.
Medium- to long-term, narrow participation and earnings continue to be a concern. On Tuesday, leadership came from this year’s laggards, such as transports, energy and metals. If operating earnings for the second quarter come in line with consensus expectations, earnings for the second half would have declined 4.9 percent over last year.
Bulls are pinning their hopes on buybacks, which should get underway as the earnings season winds down. This related tidbit from Raymond James: CVX has halted its buyback program, even as XOM has cut buybacks by more than 80 percent since the beginning of the year.
Currently net short 93.1k, up 2.6k.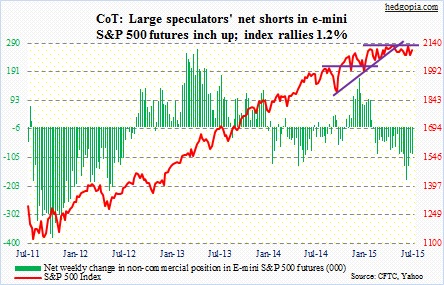
Euro: Euro zone annual inflation remained unchanged at 0.2 percent in July, and continues to remain substantially below the ECB’s target of close to two percent. Core inflation, however, accelerated to one percent – the fastest in 15 months.
This week, the IMF cited low inflation as a risk for the region, saying the ECB will have to continue its asset-buying program beyond September 2016. There you go! Money-printing as a panacea for all ills.
The euro vacillated during the week – essentially unchanged – and was denied twice by its 200-day moving average, which is trying hard to go sideways.
Currently net short 104k, down 9k.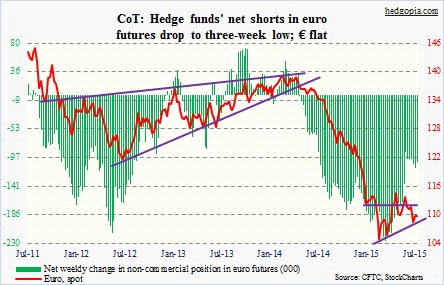
Gold: In a typical ‘when it rains, it pours’ fashion, GFMS, of Thomson Reuters, shared the following tidbits during the week.
Global demand for gold bars and coins in the second quarter was down 12 percent year-over-year – 63 percent below the peak two years ago. Retail investment from China shrunk 25 percent and jewellery demand 23 percent. In India, jewellery consumption rose 2.5 percent, but gross imports fell 10 percent to a five-quarter low.
Staying with China and India – two important markets for the metal – GFMS said China consumed 394 tonnes in the first half and India 392 tonnes. The gut-churning moves in Chinese stocks since the middle of June have not helped gold purchases there. By the way, Chinese tend to buy into rallies – evident in how retail brokerage accounts and margin debt soared in the past year. If this herd mentality prevails, they will only jump on the gold bandwagon once the metal gains some upward momentum. Maybe!
For that to happen. Gold needs to first stabilize. It pretty much went sideways this week, even though non-commercials continued to cut back net longs. GLD, the SPDR Gold ETF, had a weekly doji. Last week’s low ($103.43) is intact. The 10-day moving average is no longer dropping like a stone – and maybe in the process of flattening.
Currently net long 24.5k, down 3.8k.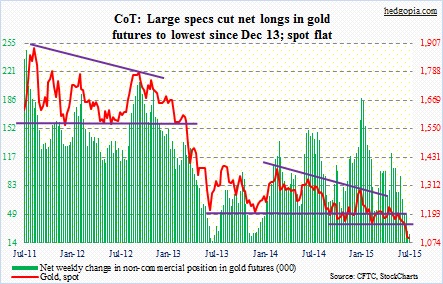
Nasdaq 100 index (mini): Last Friday, the index was literally sitting on 4,550 support, which was breached on Monday. This was the first test post-breakout two weeks ago. Potentially a failed breakout! But come Tuesday, buyers showed up near the 50-day moving average. A day earlier, the 200-day moving average was defended on the S&P 500.
Of the top five holdings, AAPL, with a weight of north of 13 percent, continues to act weak. The stock, along with MSFT, reacted negatively to June-quarter earnings. Now add FB to the list. AMZN and GOOG had positive post-earnings reaction. But it is hard to imagine new money flowing into the latter two without them unwinding at least some of the overbought conditions. In July, AMZN was up 23.5 percent, and GOOG up 20.2 percent.
The index rallied 0.7 percent for the week. Kudos to non-commercials for having raised net longs 56 percent last week, and they have continued to add.
Currently net long 90.2k, up 4.5k.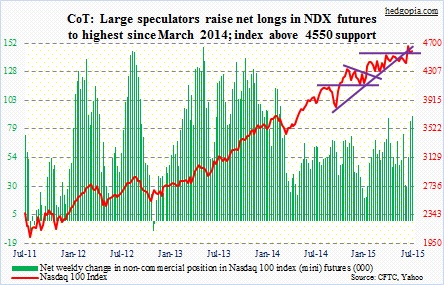
Russell 2000 mini-index: If one wanted to nitpick, here is something to doubt the quality of the rally this week. On Tuesday, only 63 percent of Russell 2000 traded higher. (On the NYSE, this was only 75 percent.) One would think participation would be a lot higher. But the important thing during that session was the reversal. Morning weakness, which at first penetrated the 200-day moving average, was bought. When it was all said and done, the session produced a hammer, and crucial support was saved.
In four sessions, from intra-day high to low, RVX, the Russell 2000 Volatility Index, shed nearly six points, and is near the low end of its recent range – and this can be a problem for the bulls.
Since it broke the mid-October 2014 trend line toward the end of April, the Russell 2000 has struggled. Immediately ahead, resistance lies at the 50-day moving average – 1.5 percent away. If the Russell 2000 cannot get traction, it will be hard for equities in general to get traction.
Non-commercials raised net shorts to a seven-week high.
Currently net short 17.4k, up 12.9k.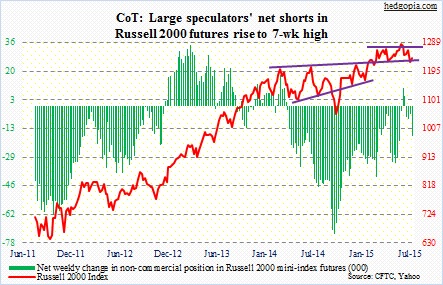
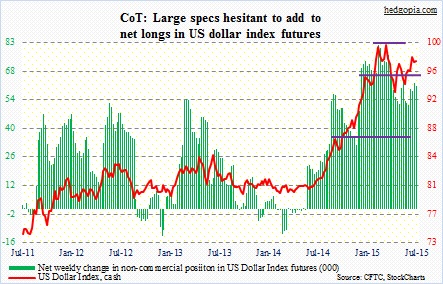
US Dollar Index: The short end of the yield curve is itching to price in a rate hike. Two-year Treasury bills mostly reflect Fed expectations. On July 8, they were yielding 0.55 percent, rising to 0.72 percent by this Thursday. In comparison, 10-year notes yielded 2.22 and 2.28 percent, respectively. After the disappointing ECI data on Friday, two-year yields fell five basis points to 0.67 percent. The US Dollar Index fell, but closed a point higher off the session lows. The dollar should like if yields on the short end sustain higher.
With that said, the two-year has also shown a tendency to be more fickle; several times at least this year, yields have risen to the 0.7-percent range only to come back down.
Currently net long 61.2k, down 1.1k.
VIX: So far this year, spot VIX has dropped below 12 five times. This week saw two of those, with all five having come since May 22nd. In the first three, VIX then proceeded to rally – twice to/near 16 and once past 20.
The last time VIX broke 11 was a little over a year ago. Equity bulls have done a good job this year of not letting VIX’s rally attempts get out of hand. At the same time, they have not been able to sustain downward pressure once VIX reaches 12.
Currently net short 53.9k, up 13.1k.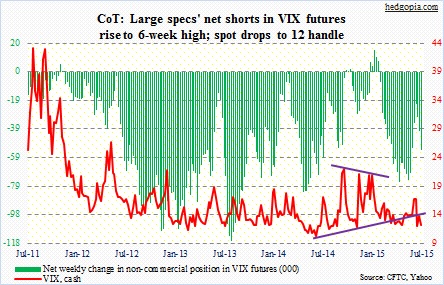
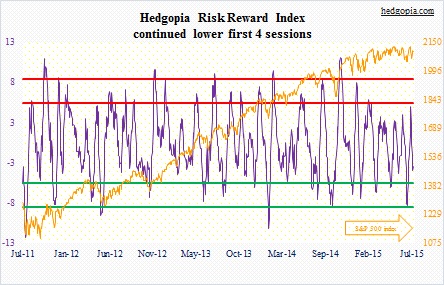
Hedgopia Risk Reward Index