The following are futures positions of non-commercials as of December 1, 2015. Change is week-over-week.
10-year note: Will it or wouldn’t it? Will the Fed switch into a tightening mode in the face of U.S. manufacturing just entering contraction?
In November, the ISM manufacturing index dropped below 50, to 48.6 – the first sub-50 reading in three years. And for the first time since May 2013 the orders component dipped below 50.
Still, the answer to the question above is a probable ‘yes’. Janet Yellen, Fed chair, this week signaled – once again – that a hike is near. To quote her from a speech she gave on Wednesday:
“Were the FOMC to delay the start of policy normalization for too long, we would likely end up having to tighten policy relatively abruptly to keep the economy from significantly overshooting both of our goals. Such an abrupt tightening would risk disrupting financial markets and perhaps even inadvertently push the economy into recession. Moreover, holding the federal funds rate at its current level for too long could also encourage excessive risk-taking and thus undermine financial stability.”
“Excessive risk-taking” jumps out in the paragraph above. If Ms. Yellen and her team have decided to focus on that phrase, then this marks a sea change. The Ben Bernanke-led Fed urged/convinced investors to get on the risk curve, and the latter obliged. There are signs of excesses in a whole host of asset classes. Unwinding those would not come without cost. So not sure Ms. Yellen meant to drive that point home.
That said, she succeeded in convincing the markets that a hike in the middle of the month is all but certain, which was further buttressed by November’s jobs report. The two-year yield rose as high as 0.96 percent. For a change, the 10-year yield rose as well, to 2.28 percent, with the spread between the two at 132 basis points, up eight basis points from just a couple of days ago.
Currently net long 15.5k, down 19.6k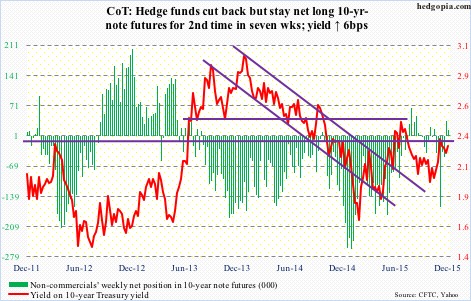
30-year bond: This week’s major economic releases are as follows.
At $3.5 trillion, consumer credit continues to chug along. In September, it was up 7.1 percent annually – the fastest pace since November 2011. Of note, student loans have reached $1.3 trillion, and auto loans $1 trillion. October’s numbers will be published on Monday.
The National Federation of Independent Business optimism index for November comes out on Tuesday. October was unchanged at 96.1, down from 100.4 in December. The latter was the highest since October 2006.
Also on Tuesday, October’s JOLTS is published. In September, job openings rose 149,000, to 5.5 million. Openings peaked at 5.7 million in July. Non-farm payroll averaged an addition of 255,000 in October and November, versus 149,000 in August and September.
Friday’s releases include producer prices and retail sales for November, and the University of Michigan’s preliminary reading of consumer sentiment for December.
The producer price index decreased 0.4 percent in October month-over-month, and core PPI fell 0.3 percent. Prices fell 1.6 percent from a year earlier – the 10th consecutive year-over-year decline. Core prices were up 0.4 percent from a year ago.
Retail sales were only up 0.05 percent in October month-over-month. The year-over-year increase of 1.7 percent was the lowest in six months, and growth has been decelerating since 4.8 percent in April last year.
Consumer sentiment rose 1.3 points in November, to 91.3, and has been decelerating since 98.1 in January this year. That was a 11-year high.
Only one Fed official is on schedule to speak on weekdays.
Currently net short 25.5k, up 3.6k.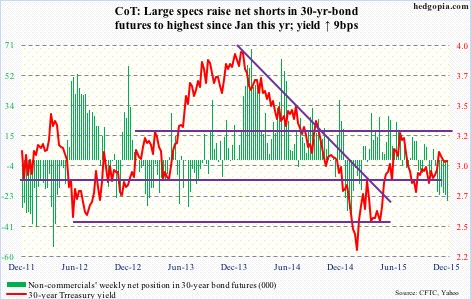
Crude oil: The EIA data for the week ended November 27th was predominantly negative.
Crude stocks rose 1.2 million barrels, to 489.4 million barrels. This was the 10th straight weekly increase, with stocks at the highest since the April 24th week.
Gasoline stocks rose by 135,000 barrels, to 216.9 million barrels – a five-week high.
Distillate stocks rose 3.1 million barrels, to 144.4 million barrels – a six-week high.
Crude production rose by 37,000 barrels a day, to 9.2 million barrels a day – a 13-week high. Production peaked at 9.61 mbpd in the June 5th week.
Crude imports rose by 414,000 barrels a day, to 7.7 million barrels a day – a 13-week high.
The only positive was refinery utilization, which continued to rise – now at 94.5 percent. It has now risen for seven straight weeks, from 86 percent in the October 9th week. Utilization peaked at 96.1 percent in the August 7th week.
Until Thursday, spot WTI was down for the week. Then came the rumor that Saudi Arabia next year plans to propose a deal to balance the market with non-OPEC help, leading the spot to rally 2.9 percent in that session. Come Friday, OPEC agrees to roll over its policy of maintaining crude production in order to retain market share.
Business as usual. Saudi Arabia wants to drive out high-cost producers, and it is sticking with the status quo.
Crude now sits on August lows, and has room to head lower on a weekly chart. It dropped 3.9 percent in the week.
Non-commercials were right to reduce net longs, which are at a three-year low.
Currently net long 217.8k, down 981.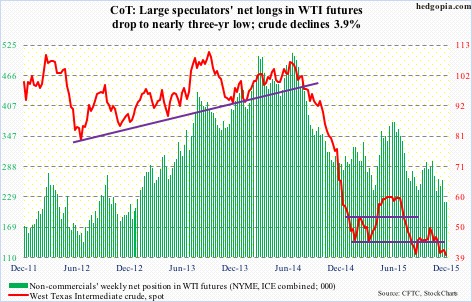
E-mini S&P 500: It is not the economy, it is the flow, stupid.
Since September 30th, inflows into U.S.-based equity funds have only totaled $10.8 billion. For the week ended Wednesday, $920 million exited these funds (courtesy of Lipper).
Off the September 29th low through the intra-day high in early November, the S&P 500 index rallied 13 percent. Well and good, but that is yet to attract oodles of money.
Foreigners have been shunning U.S. stocks for a while anyway. In September, the 12-month rolling total of net foreign purchases of U.S. equities was minus $95 billion. The last time this metric was positive was in October 2013.
From bulls’ perspective, some good news came out of NYSE margin debt in October. It rose $18 billion, to $471.9 billion – first month-over-month rise in four months. Margin debt peaked in April at $507.2 billion.
The October rise in margin debt probably went a long way in the eight-percent rise in the S&P 500 in the month. But as elevated as margin debt is, it is hard to keep up the momentum. And that is a problem for stocks – flows not cooperating, foreigners avoiding, and margin debt elevated.
That said, bulls did put their foot down on Friday.
Non-commercials continue to cut back net shorts – now sub-100,000 contracts for two weeks – and that has helped stocks.
Currently net short 96.4k, down 1.7k.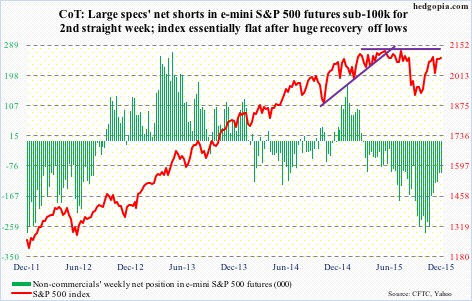
Euro: A classic ‘buy the rumor, sell the news’.
For the week, the euro rallied 2.9 percent. On Thursday alone, it jumped 3.1 percent – the largest increase since the 3.5-percent jump on March 18, 2009.
Mario Draghi, ECB president, had prepped the market for two months. Market expectations were very high. A lot was already priced in, with the euro down eight-plus percent since the middle of October.
In the end, what Mr. Draghi offered was not enough – or was not perceived enough. Maybe Jens Weidmann, Bundesbank president, prevailed.
The deposit rate was only cut by 10 basis points to minus 0.3 percent. The existing €60-billion/month asset purchase program was only extended until the end of March 2017, not increased. On second thoughts, would anything satisfy the markets? Probably not.
As oversold as it was, the euro was itching to move higher. Ironically, a strong euro does not help the Eurozone inflation outlook.
There are tons of bearish bets on the euro. If they get unwound, the currency can surprise on the upside.
Non-commercials added to net shorts, and probably got squeezed on Thursday.
Currently net short 182.8k, up 7.4k.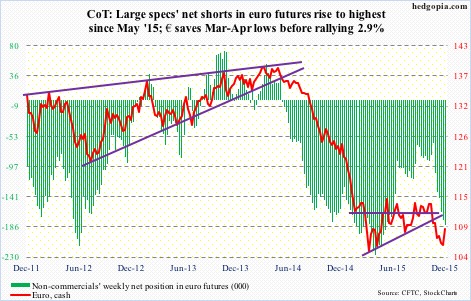
Gold: Until Thursday, spot gold was headed for another down week – its seventh. Then came the ECB decision, fueling a rally in the euro and a reversal in the dollar. The latter helped the yellow metal.
If the trend continues in the currency land – euro up, dollar down – gold bugs, beat-up and bruised, can breathe a sigh of relief, duration notwithstanding.
On a daily chart, Thursday brought a bullish MACD crossover. Friday, reacting to the jobs report, the dollar rose, as did interest rates. Gold did not flinch. It went on to rally 2.2 percent, past resistance at 1,070-1,080.
Prior to this, non-commercials had reduced net longs to the lowest since October 2002. A contrarian might find that bullish for gold – at least in the near-term.
Currently net long 9.8k, down 6.6k.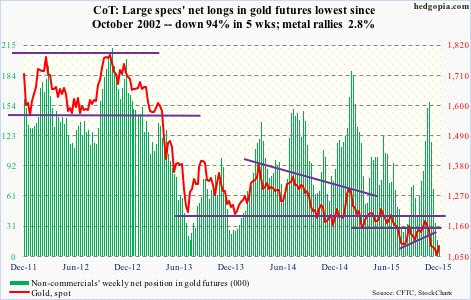
Nasdaq 100 index (mini): Since April this year, the 4560 price point has acted lack a magnet, both repelling and attracting. This week, it acted as support, with the Thursday sell-off attracting buyers near that level.
Of the major U.S. indices, the Nasdaq 100 acts the strongest, and is comfortably above both its 50- and 200-day moving averages.
That said, non-commercials have used recent strength to slightly lighten up net longs.
Currently net long 56.8k, up 1.5k.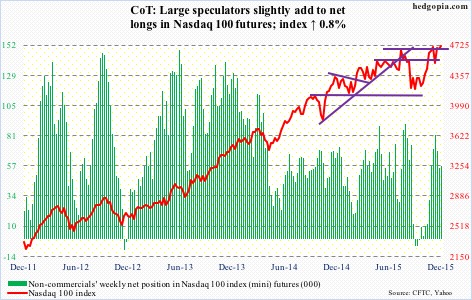
Russell 2000 mini-index: Once again, the March 2014 horizontal resistance proved too tough to handle. In four of the past five weeks, the index bumped against the 1200 range, only to retreat.
This week, it made it to 1205, right underneath 1210-1215 resistance, and that was it. This price range also approximated the 200-day moving average.
If there is any consolation, the 50-day moving average is still rising, though ever so slightly. Ditto with IWM, the iShares Russell 2000 ETF. The latter was rejected at its 200-day moving average on Monday through Wednesday.
Non-commercials have been so right not to buy into the small-cap story.
Currently net short 33.1k, down 8.4k.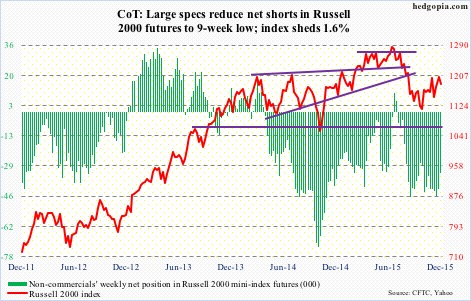
US Dollar Index: In the aforementioned speech, Ms. Yellen points out the role played by the dollar in dampening demand for U.S. exports. The dollar index has appreciated measurably since the middle of last year.
Yet, she is also having to raise interest rates.
At least on Thursday this week, the dollar index did not follow U.S. interest rates higher, rather it reacted to the 3.1-percent jump in the euro by falling 2.4 percent. The intra-day high of 100.60 in that session was a hair’s breadth away from 100.71 in March this year. This nearly retraces 61.8 percent of the July 2001-April 2008 decline, and could prove to be an important inflection point.
On a weekly basis, the dollar index remains grossly overbought, and it just started unwinding those conditions.
Leading up to this, non-commercials never looked as enthusiastic as they were when the dollar index was trading at a similar level back in March/April.
Currently net long 47.3k, up 1.2k.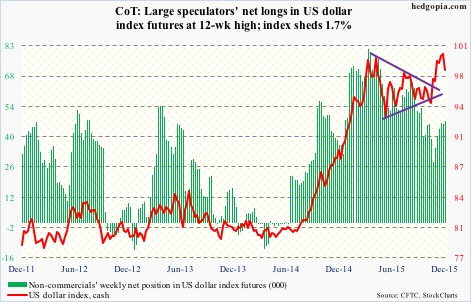
VIX: Spot VIX is searching for direction, with wild price action in the last two sessions. It gained 3.44 points on Thursday, and gave back 2.65 on Friday. Consequently, it has not moved too far away from its 200-day moving average.
Currently net short 21.7k, up 14.8k.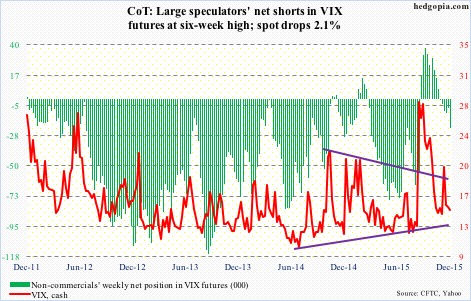
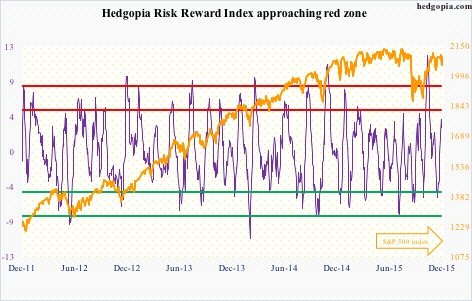
Hedgopia Risk Reward Index