The following are futures positions of non-commercials as of January 12, 2016. Change is week-over-week.
10-year note: With crude oil tanking the way it has, it is worth taking note that oil does correlate with inflation expectations. Already, the 10-year inflation breakeven rate – the spread between 10-year yields on nominal Treasury and inflation-indexed – is 1.39 percent, matching the low of late September last year.
Similarly, the five-year, five-year forward inflation expectation rate is plumbing new lows (1.66 percent as of the 14th).
Besides, yes the collapse in oil since June 2014 has to do with oversupply, but it is also reflective of the state of global growth – or a lack thereof. This then can adversely influence corporate boards’ growth expectations, and other related decisions such as capital expenditures.
This is coming at a time when at the end of 2015 S&P put 17 percent of debt-issuing companies globally on negative credit watch. This is the worst since the financial crisis.
So despite the Fed’s bravado and the FOMC dot plot’s projection of four quarter-point hikes this year, markets simply do not buy it, and are right not to do so.
The latest Beige Book particularly highlighted flat wages in the U.S.
In a speech on Wednesday, Eric Rosengren, the Boston Fed president and a voting member this year, who is otherwise one of the most dovish members of the FOMC, hinted he would not vote for another rate hike unless he sees clear improvement in the economy from here.
A day later, James Bullard, the St. Louis Fed president and a voting member, said the latest plunge in oil prices has implications for monetary policy.
Two back-to-back dovish comments!
The long end of the curve has spoken wide and clear, with the 10-year yield having dropped intra-day from 2.38 percent to 1.99 percent in the past couple of months.
Currently net short 43.2k, down 61.5k.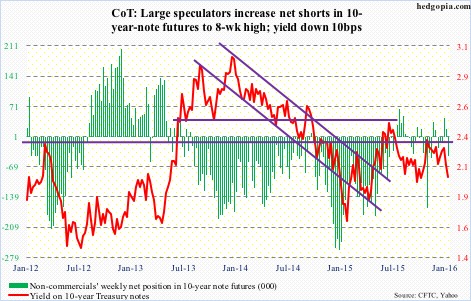
30-year bond: Major economic releases next week are as follows.
Monday is Martin Luther King Jr. Day.
The NAHB/Wells Fargo housing market index for January comes out on Tuesday. December was down a point to 62. The index reached a 10-year high of 65 in October last year.
Also on Tuesday, we get the TIC data for November. It has been a while foreigners have been exiting U.S. stocks. The last time the 12-month moving average of net foreign purchases was positive was October 2013. Separately, China, the largest holder of Treasury securities, has been cutting back, but ever so slightly. It held $1.25 trillion in October, versus $1.27 trillion in June last year; holdings peaked at $1.32 trillion in November 2013.
Wednesday has December’s consumer price index on tap. Prices were flat in November. In the 12 months through November, the CPI increased 0.5 percent. Core CPI increased 0.2 percent – the third straight month of 0.2-percent gain. And in the 12 months through November, core CPI rose by two percent (2.02 percent, to be exact) – the largest increase since May 2014. The Fed targets two percent inflation, but core PCE, its favorite inflation gauge, is running much softer.
Housing starts for December are scheduled for Wednesday as well. November was up 10.5 percent month-over-month to a seasonally adjusted annual rate of 1.17 million units, following a 12-percent decline in October. Starts reached a high of 1.21 million in June, with momentum of late. The 12-month moving average has been north of one million for 12 straight months.
December’s existing home sales are due out on Friday. In November, sales dropped 10.5 percent to a seasonally adjusted annual rate of 4.76 million units – the first sub-five million reading in nine months. The median price was $220,300, not that far away from the all-time high of $236,300 in June last year.
Currently net short 1.8k, down 6.4k.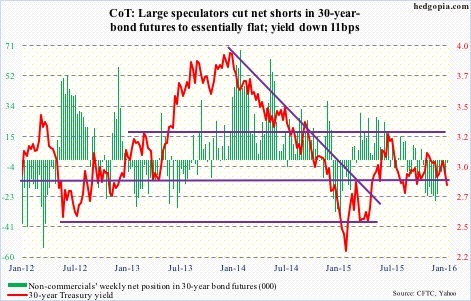
Crude oil: Oil prices dipped below $30/barrel on Tuesday for the first time in 12 years. Hat tip to brokers with calls that once looked insanely bearish – most notably Citibank (C), Goldman Sachs (GS), and Morgan Stanley (MS) that each have a $20 call on spot West Texas Intermediate crude.
The EIA report for the week of January 8th was no help to the crude.
Stocks increased by 234,000 barrels, to 482.6 million barrels. Four weeks ago, stocks were 490.7 million barrels, which was a hair’s breadth away from the all-time high 490.9 million barrels in the April 24th week.
Production rose by 8,000 barrels per day, to 9.23 mbpd – a 20-week high. Production peaked at 9.61 mbpd in the June 5th week.
Refinery utilization fell by 1.3 percent, to 91.2 percent – an eight-week low. Utilization peaked at 96.1 percent in the August 7th week.
Gasoline stocks surged 8.4 million barrels, to 240.4 million barrels – the highest since the February 13, 2015 week. This was the ninth straight weekly increase.
Distillate stocks rose by 6.2 million barrels, to 165.6 million barrels – the highest since the January 21, 2011 week.
With the 6.7-percent drop this week on spot WTI, the first line of resistance lies at $32, then $34.50 and then $38, then… resistance is galore.
Non-commercials continue to reduce net longs, with holdings at the lowest since July 2012.
Currently net long 175.9k, down 20.3k.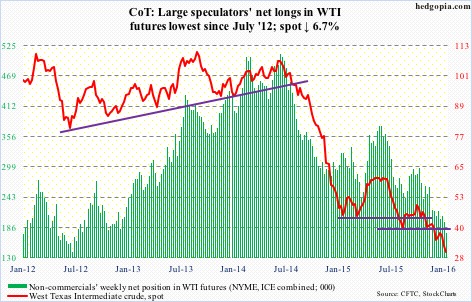
E-mini S&P 500: Through Wednesday, $21 billion left U.S.-based equity funds this year – $9 billion in the latest week (courtesy of Lipper). No wonder stocks have taken a shellacking.
That said, at the risk of sounding desperate, here is a silver lining in the cloud. Major indices are near/slightly past September lows. Since September 30th (the S&P 500 bottomed on the 29th), nearly $30 billion has been withdrawn. Despite these huge outflows, stocks have only gone sideways.
At least in the near-term, the path of least resistance is probably up. However, unlike in late September from where major U.S. indices all rallied double digits, this time around stocks may not be as lucky. The difference between then and now is short interest.
On the Nasdaq, end-December short interest stood at 8.7 billion shares, versus 9.5 billion three months ago. On the NYSE, this was 17.4 billion and 18.4 billion, in that order. This is true across sector/industry ETFs, with energy being the major exception. Potential short-squeeze fuel is lacking.
After a six-percent collapse in the prior week, the S&P 500 lost another 2.2 percent this week.
Non-commercials played it perfectly, having raised net shorts to an 11-week high. That said, holdings are substantially less than during September/October last year.
Currently net short 162.3k, up 58.1k.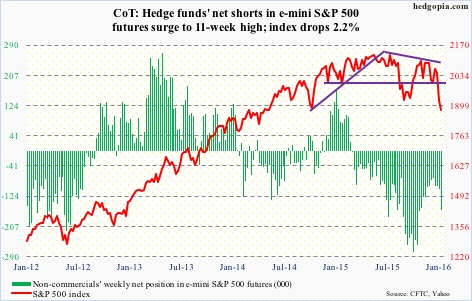
Euro: Early last month, the ECB cut its deposit rate by 0.1 percent to minus 0.3 percent as well as extended the existing stimulus program by six months to March 2017.
Markets were disappointed. That was not accommodative enough. The euro shot up 3.1 percent on December 3rd, and European stocks sold off.
It turns out some policymakers wanted a bigger cut in the deposit rate in that meeting. Minutes were released on Thursday. However, some others felt more accommodation would come with risks and could end up tightening financials conditions in Europe.
Mario Draghi, the ECB president, has a tough job at hand – trying to form a consensus between die-hard doves and skeptical hawks.
Non-commercials, who stayed essentially flat in the past four weeks, cut holdings this week to a nine-week low.
Currently net short 146.5k, down 14.2k.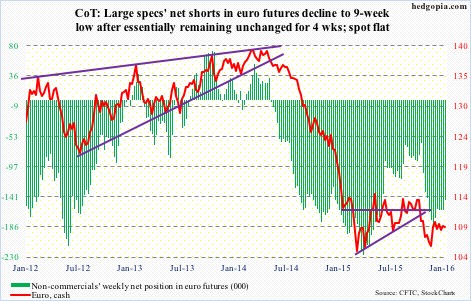
Gold: ETF.com points out that for the week ended Wednesday GLD, the SPDR Gold ETF, attracted $305 million. The metal went on to lose 1.4 percent this week anyway.
Using last Friday’s intra-day high, spot gold rallied five percent in the first five sessions, before hitting a roadblock. Although the drop this week puts it slightly past 1,080 support, which also approximates the 50-day moving average.
After having substantially cut back net longs since particularly October last year, non-commercials have been adding of late, but not with aggression.
Currently net long 44.7k, up 18.2k.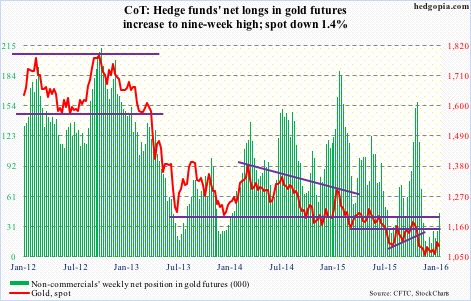
Nasdaq 100 index (mini): After an incessant rally, the Nasdaq 100 produced a doji in November, followed by a red candle in December. So far this month/year, it is down 9.8 percent.
The decline is coming in the wake of a relatively strong 8.4-percent rally last year, driven primarily by the likes of Facebook (FB), Amazon (AMZN), Netflix (NFLX) and Alphabet (GOOGL, formerly Google). The so-called FANG.
Interestingly, of the four, AMZN, FB and GOOGL had a monthly doji in December, while NFLX had what looks like a shooting star. These are all exhaustion signs, and could signal a sharp shift in sentiment.
Month/year-to-date, NFLX is down nine percent, AMZN down 15.6 percent, GOOGL down 8.7 percent, and FB down 9.3 percent.
The index is grossly oversold on a daily basis. Bulls need to first clear resistance at 4350, which goes back to November 2014.
Non-commercials reduced net longs further, to a 12-week low.
Currently net long 33.2k, down 2.7k.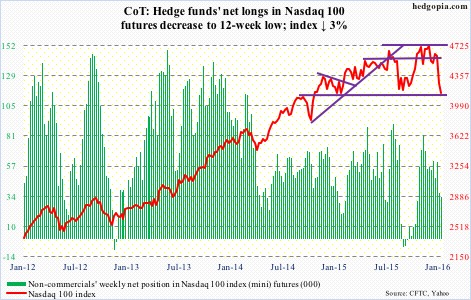
Russell 2000 mini-index: Small-caps get no love. In fact, they have been shunned for a while now.
In the current market mayhem, the Russell 2000 is one of the two major U.S. indices to have undercut October 2014 lows. The S&P 400 mid-cap index is the other.
In the process, the Russell 2000 now faces strong resistance at 1080, which goes back two-plus years. On its way to losing this support, the index faced strong resistance at 1210-1215, which goes back nearly two years, and then 1170.
Kudos to how well non-commercials played the downdraft in small-caps. They held firm even when the Russell 2000 rallied strongly to test the 1210-1215 resistance early December.
Net shorts are at the highest since October 2014.
Currently net short 55k, up 4.6k.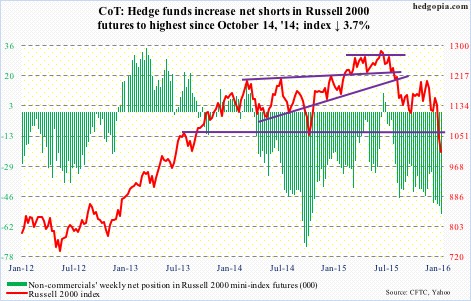
US Dollar Index: The Treasury yield curve is flattening. The two-year bill is now yielding 0.85 percent, down from 1.09 percent in late December. Lower yields, plus the Japanese yen’s perceived safe-haven status, is robbing the dollar index of an opportunity to rally during this time of uncertainty and risk-off.
This is probably as good a sign as any that the index is in the process of peaking.
After rallying 25 percent since the middle of 2014, it backed off after reaching 100-plus, a level that was retested in November. No breakout, but the index continues to hover near those highs.
Non-commercials are not anticipating a breakout either. Holdings are substantially less versus during the afore-mentioned highs.
Currently net long 42.7k, up 2k.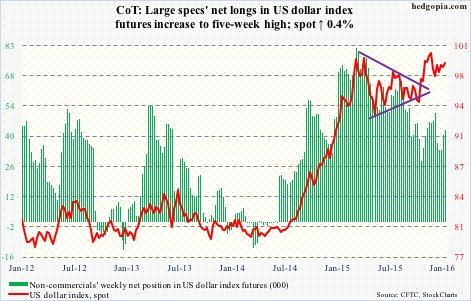
VIX: The S&P 500 yesterday undercut August/September 2015 lows, yet spot VIX was nowhere near its level back then.
That said, back in 2010, 2011 and of course last August, VIX peaked in the high 40s/low 50s, before stocks could hammer out an important bottom.
The odds of a similar spike are looking slim. The spot keeps squandering opportunities to hang on to intra-day gains. On Friday, it shot up to just under 31, but closed up only 12.8 percent to 27.02 – flat for the week.
A reversal may be round the corner.
Concurrently, for the second week, the VIX:VXV ratio closed north of one – 1.03 and 1.01, respectively.
Currently net short 6.6k, down 3.2k.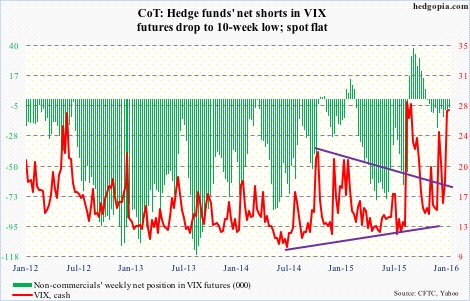
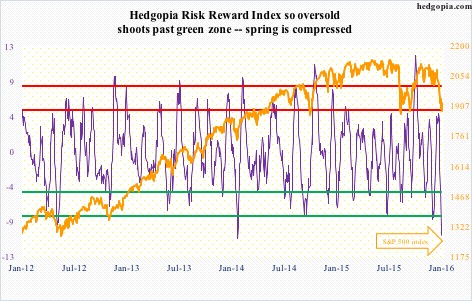
Hedgopia Risk Reward Index