The following are futures positions of non-commercials as of February 9, 2016. Change is week-over-week.
10-year note: On June 5, 2014, the ECB cut the deposit rate for the euro zone’s commercial banks to minus 0.1 percent from zero. It was a historic first. By December last year, it has been further lowered to minus 0.3 percent.
When euro zone rates first went negative back then, European financials took the decision in stride. Investors were anything but fleeing en masse. Now they are. Now, negative interest rates are one reason cited for the widespread sell-off in financials.
Investor sentiment has done a 360.
In the wake of the financial crisis when central bankers were just getting started with monetary activism, equities globally soared. But as it turns out, these unconventional measures – from quantitative easing to zero interest-rate policy to negative interest rates – have failed to act like a panacea. Hence the question becomes, when might markets begin to lose patience and then do a 360?
On January 29th this year, in a 5-4 vote, Haruhiko Kuroda, Bank of Japan governor, pulled a huge surprise to the market, pushing interest rates to negative territory, the Nikkei rallied, closing at 17518. The yen sold off. Fast forward 10 sessions, the Nikkei is much lower and the yen much stronger – not what Mr. Kuroda had in mind. Markets are not going along… in fact, have not been going along for a while now.
On October 31, 2014, the BoJ shocked global markets by massively expanding its stimulus program equating to about $60 billion of quantitative easing per month. It was another 5-4 vote. Markets reacted favorably.
More than a year later, on December 18th last year, Mr. Kuroda again tried to pull his trademark shock and awe, by announcing plans to increase purchases of ETFs as well as lengthen the maturity of bonds the bank purchases. The Nikkei first rose as much as 2.7 percent only to close down 1.9 percent. A big yawn from Mr. Market.
On October 30th (2014), the Nikkei closed at 15658, went on to rally to 20953 (by June 24, 2015). On Friday, it closed at 14953. Are Abenomics and Mr. Kuroda’s shock and awe still working? Markets beg to differ. They are voting… with their feet.
This must be sending chills down major central banks’ spine… the thought of markets not acting at the beck and call of central-bank omnipotence. Assuming a trend has begun, interesting times lie ahead. Buckling up intermediate- to long-term.
Currently net short 62.3k, up 68.2k.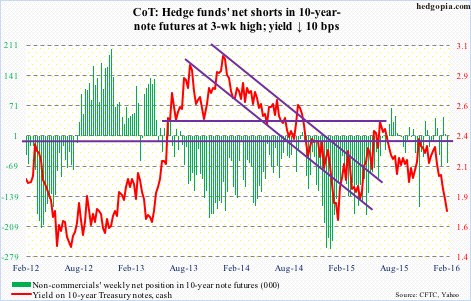
30-year bond: Major economic releases next week are as follows.
Happy Presidents Day! Markets are closed on Monday.
Tuesday brings February’s NAHB/Wells Fargo housing market index. Builder sentiment was 60 in January, unchanged from December, and down from 65 in October, which was a 10-year high.
Also on Tuesday, December’s Treasury International Capital data is published. Of note, China held $1.26 trillion in U.S. Treasurys in November – down from the all-time high of $1.32 trillion in November 2013 but more or less sideways since April 2014. Separately, foreigners continue to leave U.S. stocks, with the 12-month rolling total of foreigners’ purchases of U.S. equities at minus $107 billion in November – a record.
Wednesday brings housing starts (January), industrial production (January), PPI-Final Demand (January), as well as FOMC minutes.
December housing starts dropped 2.5 percent month-over-month to a seasonally adjusted annual rate of 1.15 million units – lower than the June 2015 high of 1.21 units. That said, for the past 13 straight months, the 12-month rolling average has been north of a million, with December’s 1.1 million units the highest since June 2008.
Capacity utilization in December was 76.5 percent – the lowest since July 2013. The cycle peaked in November 2014 at 79 percent. Likewise, industrial production peaked in December 2014 at 107.9, and had dropped to 106 in the next year.
Producer prices fell 0.2 percent m/m in December and by one percent in the 12 months through December. Core PPI rose 0.2 percent m/m in December and 0.3 percent in the 12 months through December.
January’s CPI is published on Friday. Consumer prices slipped 0.1 percent m/m in December and rose 0.7 percent in the 12 months through December. Core CPI inched up 0.1 percent m/m and 2.1 percent in the 12 months through December… the latter was the largest increase since July 2012.
Six Fed officials have public appearances scheduled during weekdays – all of them reserve bank presidents.
Currently net short 1.9k, up 13.2k.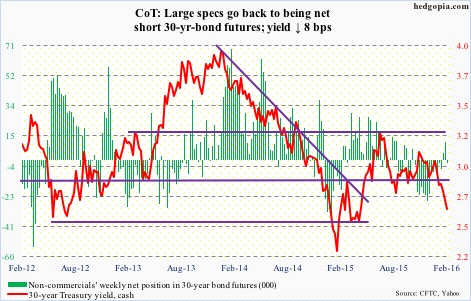
Crude oil: For the week ended February 5th, U.S. crude stocks dropped by 754,000 barrels, to 502 million barrels. Positive news, except that the prior period was an all-time high (502.7 million barrels). In the past five weeks, inventory has gone up by nearly 20 million barrels.
Gasoline stocks jumped another 1.3 million barrels, to 255.7 million barrels – yet another record (data goes back to 1990). This was the 13th straight weekly increase.
Just when U.S. supply is sitting at record levels, the IEA says global growth demand will “ease back considerably” this year. Oil demand growth globally peaked at 1.6 million barrels a day in 2015. This is now projected to decelerate to 1.2 mb/d this year.
Never a good thing – a supply-demand imbalance.
Other data in the weekly EIA report include:
Distillate stocks rose by 1.3 million barrels, to 161 million barrels. Four weeks ago, stocks (165.6 million barrels) were the highest since the January 21, 2011 week.
Refinery utilization fell by one half of one percent, to 86.1 – a 17-week low. Utilization peaked at 96.1 percent in the August 7th week.
Crude imports fell by 1.1 million barrels per day, to 7.1 mb/d. The prior period was a seven-week high.
Crude production dropped by 28,000 barrels per day, to 9.19 mb/d – a seven-week low. Production peaked at 9.61 mb/d in the June 5th week.
Spot West Texas Intermediate crude made an intra-day low of $26.05 on Thursday, before the session produced a hammer reversal. Friday, it rallied 6.3 percent. This probably improves the near-term picture. Although resistance is huge at $34-$35. The rapidly dropping 50-day moving average lies at $33.78.
Currently net long 203.7k, up 12.2k.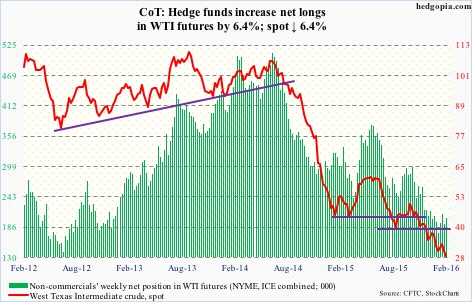
E-mini S&P 500: In the week ended Wednesday, another $1.5 billion left U.S.-based equity funds (courtesy of Lipper). One has to go back to the week ended December 30th to see inflows (to the tune of $10 billion). Since then, there have been six straight weeks of outflows, totaling a whopping $35.4 billion.
That said, during the week ended Thursday, SPY, the SPDR S&P 500 ETF, did attract a decent amount – $5.9 billion, to be exact (courtesy of ETF.com). This was before Friday’s 2.1 percent rally.
Flows need to cooperate for this rally to have legs. Obviously, 1880 is huge. Not only does this resistance go back to March 2014, but is also a confluence of 10- and 20-day moving averages.
Currently net short 234.3k, up 8.4k.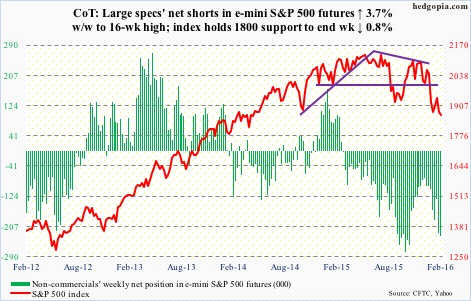
Euro: German industrial production unexpectedly fell in December, down 1.2 percent and down for a second straight month.
On December 3rd last year, the euro rallied 3.1 percent, as markets apparently decided that Mario Draghi, ECB president, failed to live up to expectations and that he was not dovish enough. Two months later, the currency rallied another 1.6 percent. This time past the 200-day moving average.
With a nearly eight-percent rally since early December, the euro’s strength is definitely not music to euro zone exporters’ ears. Not to mention Mr. Draghi.
At least near-term, they can heave a sigh of relief, as the euro’s path of least resistance is down. Support at 111 likely gets tested… the 200-day moving average lies at 110.65.
Non-commercials’ continue to reduce net shorts – to a 16-week low.
Currently net short 63.3k, down 23.8k.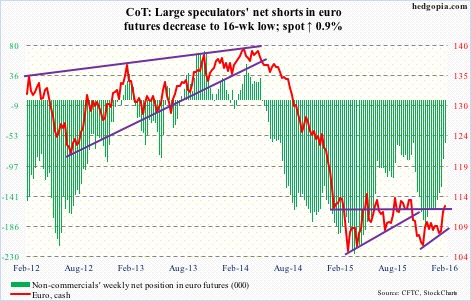
Gold: Gold bugs must be giddy with the metal’s action this week in particular. Two separate resistance levels were conquered.
First, it broke out of a descending trend line going back to April 2013. That trend line persistently repelled gold’s rally attempts, the most recent of which was in October of last year. Then it broke out of a November 2009 horizontal trend line.
The $1,180 resistance has been breached. Plus, there is a monthly bullish MACD crossover.
That said, the spot is way extended near-term. And a breakout retest is possible in the sessions ahead.
Non-commercials continue to add to net longs, with holdings at a 14-week high. This group of traders is worth watching.
Currently net long 98.4k, up 25.6k.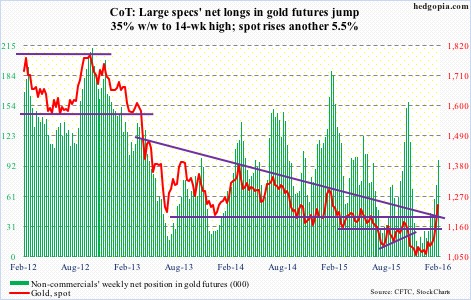
Nasdaq 100 index (mini): Down as much as 3.4 percent on Monday’s intra-day lows, the Nasdaq 100 had an impressive end to the week – only down 0.13 percent. Has tons of room to rally from here – if nothing else just to unwind oversold conditions, both daily and weekly.
The nearest resistance lies at just under 4100, and the line can be drawn as far back as September 2014. Shorter-term averages lie around there as well, and they are still dropping. More consolidation is needed so they begin to hook up.
In the week ended Thursday, $665 million came out of QQQ, the PowerShares Nasdaq 100 ETF (courtesy of ETF.com).
Non-commercials continue to reduce net longs – now sub-10k. Holdings are at a 19-week low.
Currently net long 9.6k, down 12.1k.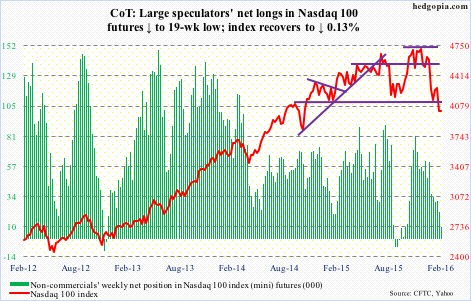
Russell 2000 mini-index: In the week ended Wednesday, $492 million moved into IWM, the iShares Russell 2000 ETF (courtesy of ETF.com).
This was before Thursday’s action when the January 20th low was breached before staging a mini-reversal. A rally is possible near-term, but needs to first take out 985 and then 1000.
Non-commercials reduced net shorts by 20 percent.
Currently net short 49.5k, down 12.4k.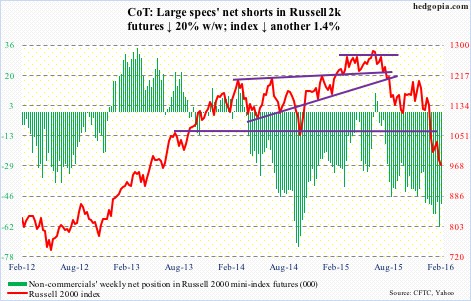
US Dollar Index: On a daily chart, the index is grossly oversold, and the action on both Thursday and Friday suggest a reprieve is in order at least near-term.
That said, the nearest resistance lies at just under 97, which also approximates the 200-day moving average (96.88).
Non-commercials continue not to show enthusiasm for the dollar index. Net longs dropped 22 percent w/w.
Currently net long 35k, down 9.9k.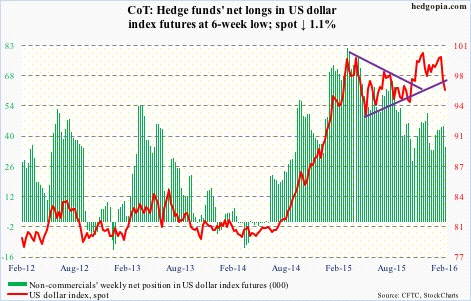
VIX: Spot VIX likely flashed a spike-reversal signal on Thursday, surging to 30.90 intra-day just outside the upper Bollinger Band. Friday, it closed at 25.40. There is plenty of room near-term for it to continue lower.
Intermediate-term, however, the 50-day moving average is now rising, as is its 200-day cousin, so they should provide support.
Incidentally, using intra-day highs on Thursday, the VIX-to-VXV ratio spiked to 1.05. This was followed by an intra-day reading of a 1.11 in the prior week. These are high readings, and once they begin to come under pressure, stocks tend to do well.
Currently net long 19.7k, down 2.8k.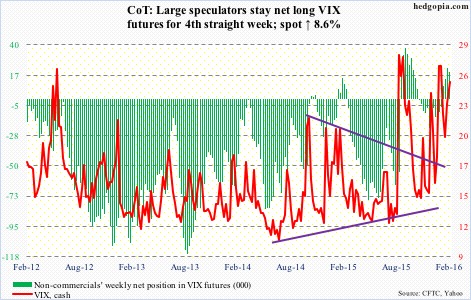
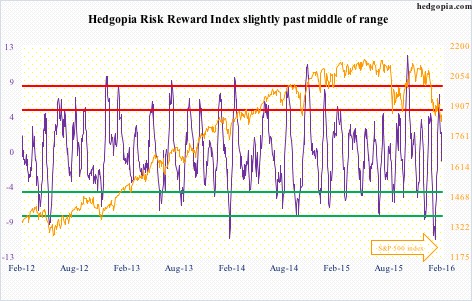
Hedgopia Risk Reward Index