The following are futures positions of non-commercials as of February 23, 2016. Change is week-over-week.
10-year note: Negative interest rates have suddenly become the topic du jour. Last month, Japan waded into negative interest rate policy (NIRP). This was totally unexpected, took the market by surprise.
With this, Japan joins Denmark, Sweden, Switzerland, and of course the Eurozone. The latter instituted its in June 2014.
Having tried near-zero interest rates as well as quantitative easing before moving onto NIRP, these central banks are tacitly admitting that their previous policies have failed to yield desired results.
What exactly did they want? The goal of course is/was to weaken the currency, ignite inflation, force companies and individuals to get on the risk curve, and consume.
Despite NIRP, the Swiss franc remains relatively strong. In Denmark, however, inflows did stop, enabling that nation to maintain its peg to the euro. The ECB has not had much success in pushing up inflation, but the euro is weaker by nearly 20 percent. Japan just introduced its on January 29th; since then, the Nikkei is lower, the yen substantially higher, and there are reports of cash hoarding. Talk about unintended consequences.
Enter the Fed.
Last week, Janet Yellen, Fed chair, told Congress that she was not aware of any law that prevented the bank from doing so, but at the same time hedged by saying they have not completely researched whether that would be legal.
Legality aside, when the next downturn hits, NIRP is one of the tools the Fed is likely to consider. Its conventional monetary toolbox is empty, and it already tried ZIRP as well as three iterations of QE. After all this, we are still talking stimulus! The ten-year yield has slipped back below two percent.
Sadly, in all likelihood, NIRP is not the panacea that the Fed, and other major central banks, are pining for.
Stanley Fischer, Fed vice chair, has a point when he said the other day the Fed is looking at negative rates but has no plans to use them.
Currently net long 84.7k, up 124.9k.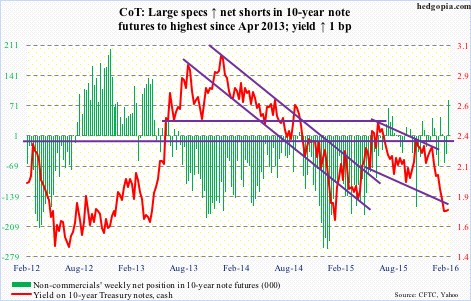
30-year bond: Major economic releases next week are as follows.
Monday brings us the pending home sales index for January. December was up one-tenth of a percent to 106.8. The cycle high was reached last May at 112.3 – the highest since May 2006. Existing home sales, which track pending home sales, rose 0.4 percent month-over-month in January to a seasonally adjusted annual rate of 5.47 million units. The cycle high of 5.48 million units was reached in July last year – the highest since 5.79 million in February 2007.
February’s ISM manufacturing index is published on Tuesday. The index has been sub-50 the past four months. This is the first time in the current recovery this has happened. The new orders index has been sub-50 three out of last five months, with a rise of 2.3 points to 51.5 in January.
The ISM non-manufacturing index for February comes out on Thursday. Non-manufacturing has been faring much better than manufacturing – relatively speaking. But even here, momentum is in deceleration. The index was 63.4 last July, and was at 53.9 in January. That said, it is still above 50. Ditto with new orders, with January coming in at 56.5; the last time it dipped below 50 was in July 2009.
Thursday also brings revised productivity numbers for the fourth quarter. The preliminary reading showed non-farm output per hour decreased at a three percent annual rate. Annual average productivity increased 0.6 percent from 2014 to 2015. This follows growth of 0.7 percent in 2014, a flat 2013, and growth of 0.9 percent and 0.2 percent in 2012 and 2011, respectively. Very subdued!
January’s advance durable goods report was reported this week. The full report comes out on Thursday. Momentum is completely out of this series. Orders for non-defense capital goods ex-aircraft – proxy for business capital expenditures – fell 2.9 percent year-over-year in January to a seasonally adjusted annual rate of $69 billion. This was the 12th straight y/y decline. Orders peaked at $74 billion in September 2014.
Friday is big. February’s employment report is on tap. With non-farm payroll addition of 151,000, January broke the momentum of 4Q15, which produced an average 279,000. Overall, momentum is decelerating, with an average 228,000 in 2015, down from 251,000 in 2014. That said, trend is improving in wages. Average hourly earnings of private-sector employees have grown north of 2.5 percent annually in three out of the last four months. December’s 2.68 percent was the highest since 2.69 percent in July 2009.
Only one Fed official has a public appearance scheduled during weekdays.
Currently net long 23k, up 9.5k.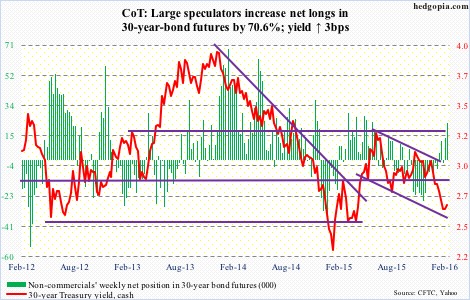
Crude oil: Well, that did not take long. Iran poured cold water on hopes of a mega deal to cut production. Its oil minister apparently said the production freeze is “a joke,” because it does not allow that nation to regain its production share lost during the sanctions.
Last week, OPEC bigwig Saudi Arabia along with fellow members Qatar and Venezuela agreed with non-OPEC Russia to freeze output at January levels, which were near record highs. The market is already oversupplied by an estimated one million to two million barrels a day. They need a cut, not a freeze. This week, S. Arabia ruled out production cuts.
No wonder, the IEA says “…in the short term there is unlikely to be a significant increase in prices,” adding that the current glut of cheap oil will keep prices low into next year at least.
The IEA also said U.S. shale oil production could fall by 600,000 barrels per day this year and another 200,000 bpd in 2017.
In fact, from the peak, U.S. production has already declined by 500,000 bpd. Production reached a record 9.61 mb/d in the June 5th (2015) week. For the week ended February 19th, production fell 33,000 b/d to 9.1 mb/d. For some perspective, production has doubled in the past decade.
Secondly, if the afore-mentioned freeze is implemented and production does come down, helping oil price stabilize, it is very possible that a lot of U.S. shale production that would otherwise shut off survives. How that would impact the glut situation is anyone’s guess.
For the week ended February 19th, U.S. crude stocks jumped another 3.5 million barrels, to a new record 507.6 million barrels.
Stocks jumped despite crude imports dropping 117,000 b/d to 7.8 mpd. Imports have dropped by 454,000 b/d in the past four weeks.
Refinery utilization fell one percentage point to 87.3. Utilization peaked at 96.1 percent in the August 7th (2015) week.
Gasoline and distillate stocks had something good to report. Both fell – the former by 2.2 million barrels to 256.5 million barrels (prior week was a record), and the latter by 1.7 million barrels to 160.7 million barrels.
Non-commercials raised net longs by 35 percent. This was the largest week-over-week increase since October 2010. Spot West Texas Intermediate crude rallied nearly 11 percent in the week, and was up 16.7 percent at one time. Friday, it could not hang on to early gains. Once again, resistance at $34-$34.50 came on the way. Daily indicators are now overbought.
Currently net long 206.7k, up 53.9k.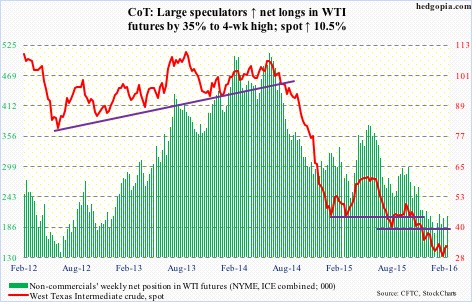
E-mini S&P 500: Does it ever stop? Outflows that is.
In the week ended Wednesday, the S&P 500 was essentially unchanged, with swings both ways. But on Monday, it was repelled at its 50-day moving average, which at the time was just under 1950. Since January 13th, this was the third time the index had tried to take out 1950, and failed.
It is possible this failure led longs to continue to withdraw money. In that week, another $2.8 billion came out of U.S.-based equity funds (courtesy of Lipper). Since the year began, nearly $44 billion has left. This despite the fact that the index is now only down 4.7 percent for the year. At one point, it was down north of 11 percent. Investors/traders are using strength to exit.
Will this behavior change now that the index is past its 50-day moving average and is once again knocking on that 1950 resistance?
At least by Wednesday, SPY, the SPDR S&P 500 ETF, lost nearly $4 billion (courtesy of ETF.com). Recall that that session saw a massive intra-day reversal, with the S&P 500 rallying 2.1 percent from the low. This was followed by a Thursday mini breakout, but Friday saw it going back below 1950.
The path of least resistance near-term is down.
Currently net short 208.1k, up 49.3k.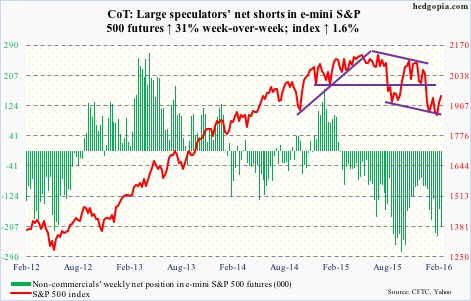
Euro: January’s final reading of Eurozone inflation was revised lower. The annual inflation rate was originally estimated at 0.4 percent, which has now been revised lower to 0.3 percent, although higher than 0.2 percent in December.
This probably gives more fodder for ECB doves that continue to press for more stimulus. In the January meeting, the governing council unanimously concluded that their policy needed to be reviewed and possibly reconsidered in March.
The week brought some goodies for hawks as well. Household borrowing climbed 1.4 percent year-over-year in January, and the M3 money supply rose five percent, to €10.9 trillion.
The currency has lost 111 support, as well as its slightly declining 200-day moving average. Intermediate-term, it can come under pressure. Weekly momentum indicators have just turned lower.
That is not what non-commercials seem to be expecting, though. Net shorts are the lowest since June 2014.
Currently net short 46.9k, down 1.3k.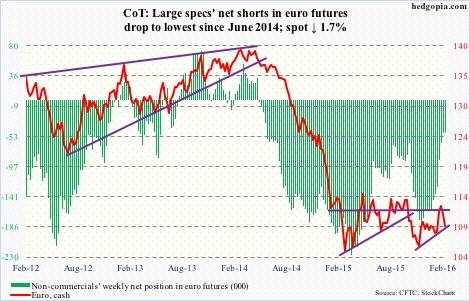
Gold: Less than $5 separate from completing a potentially bullish golden cross.
Money continues to flow into gold ETFs. In the week ended Wednesday, GLD, the SPDR Gold ETF, pulled in another $1.9 billion (courtesy of ETF.com).
That said, the metal increasingly is sending out signs of fatigue near- to intermediate-term.
In the past couple of weeks, non-commercials’ net longs have gone up by 47 percent, gold is down 1.3 percent.
Off its December 3rd low ($1045.4) through February 11th high ($1263.9), spot gold rallied nearly 21 percent. Since that high, it has essentially gone sideways.
For the past nine sessions, gold has traded around its 10-day moving average, which is now pointing lower. Daily MACD just completed a bearish crossover. And this week produced a long-legged doji/spinning top, after a hanging man in the prior week.
Gold wants to go lower for now. In the event of a pullback, support lies at $1180, followed by $1140.
Currently net long 145k, up 27.6k.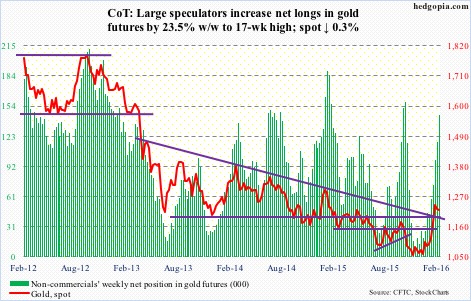
Nasdaq 100 index (mini): On the back of a 3.6-percent rally last week, the index tacked on another 1.7-percent increase this week.
It is now within spitting distance of resistance at 4300-4350. In fact, it rallied to 4276 on Friday before pulling back and ending the session lower. A convincing breakout would be a major win for the bulls. The declining 50-day moving average lies at 4293 as well.
Flows continue not to cooperate. In the week ended Wednesday, QQQ, the PowerShares Nasdaq 100 ETF, lost another $625 million.
That said, for the first time in five months, non-commercials went net short last week. This week, they went slightly net long. Back in September last year, they stayed net short for a couple of weeks, before switching back into net long, and that was a major tailwind for the index. Will history repeat itself? Wouldn’t be easy. It is getting way extended on a daily chart.
Currently net long 2.9k, up 3.2k.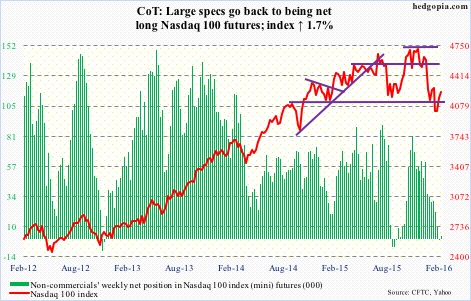
Russell 2000 mini-index: Signs of life are emerging in small-caps. After a 3.9-percent rally in the prior week, the index rallied 2.7 percent this week. It is outperforming its major U.S. indices.
Money, however, continues to leave. In the week ended Wednesday, IWM, the iShares Russell 2000 ETF lost another $377 million (courtesy of ETF.com). As well, non-commercials continue to have sizable net shorts.
The Russell 2000 is a solid short if it manages to rally to 1080.
Currently net short 58.2k, up 7k.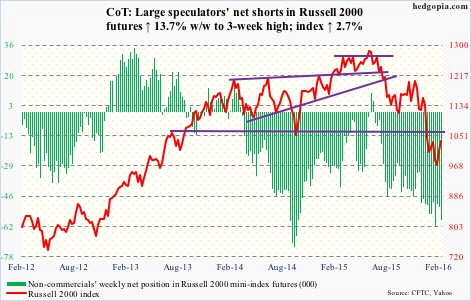
US Dollar Index: At long last, resistance at 97 was won over. But non-commercials continue to act as party poopers.
Net longs continue to shrink – now at 18-week low.
Currently net long 29.4k, down 1.9k.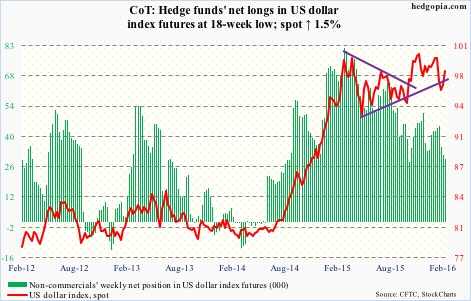
VIX: Equity bulls should like the fact that spot VIX just had a weekly bearish MACD crossover, and it has tons of room to go lower still on a weekly basis.
They wouldn’t like this, however. Daily momentum indicators are grossly oversold, with the now slightly rising 200-day moving average providing support on Friday. Spot VIX has not traded below that average since December 29th.
Near-term, daily should win.
Currently net long 25.9k, down 805.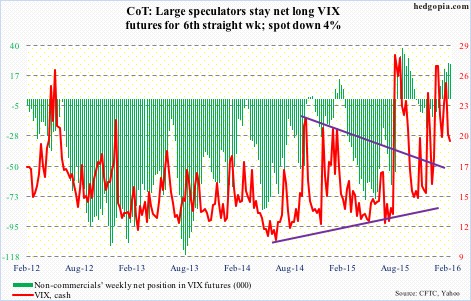
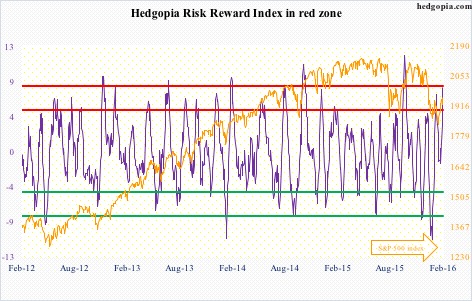
Hedgopia Risk Reward Index