The following are futures positions of non-commercials as of March 15, 2016. Change is week-over-week.
10-year note: Major central banks are in a race as to who can ‘shock and awe’ the markets the most.
On January 29th, Haruhiko Kuroda, Bank of Japan governor, pulled a ‘negative interest rate policy’ rabbit out of his ‘insanely unconventional monetary policy’ hat – taking everyone by surprise.
Then on March 10th, Mario Draghi, European Central Bank president, literally went all in, with a variety of stimulus measures. Markets were expecting some handouts, but Mr. Draghi delivered much more.
This week, it was Janet Yellen’s, Fed chair, turn.
In the middle of last December, when the Fed raised the fed funds rate for the first time in nine years, the FOMC dot plot forecasted four more hikes this year. Three months later, members are now expecting two. In the press conference, Ms. Yellen’s hawkish-to-dovish transformation was palpable.
If she is to be graded by markets’ reaction in the short term, she succeeded. Wednesday through Friday this week, the S&P 500 rose 1.7 percent, and the dollar index dropped two percent on Wednesday and Thursday.
Long-term is anyone’s guess. The Fed is increasingly painting itself into a corner, beholden to the market. For an entity that is married to the virtues of wealth effect, it is having to find newer reasons not to hike. This week, it once again dwelt on risks abroad.
Makes one wonder how long before it will find reasons to add more stimulus.
Albert Einstein is credited with saying “The definition of insanity is doing the same thing over and over again, but expecting different results”. Although there is no hard evidence he actually said it. Whoever said it, the quote applies so well to the Fed, and, of course, the ECB and the BoJ.
Currently net long 65.1k, down 3k.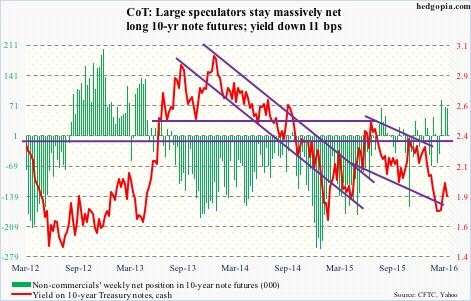
30-year bond: Major economic releases next week are as follows.
Existing home sales for February are published on Monday. January was essentially unchanged month-over-month to a seasonally adjusted annual rate of 5.47 million units, and not that far away from the cycle high 5.48 million last July. Pending home sales, which tend to lead existing home sales, fell 2.7 points m/m in January to 106. The cycle high of 111.2 was reached last April.
February’s new home sales are due out on Wednesday. January was down 9.2 percent to 494,000 units (SAAR). Still, the 12-month running average was a healthy 500,000, down slightly from the cycle high 503,000 in December.
The advance report on durable goods for February is scheduled for Thursday. Orders for non-defense capital good ex-aircraft – proxy for business capital expenditures – rose 3.9 percent in January to $69 billion (SAAR). Orders have declined year-over-year for 12 straight months. February last year was $67.4 billion; orders remained in the low $70-billion range for months before that. This raises the odds of y/y growth in at least the next few months.
On Friday, the final estimate for fourth-quarter GDP is published. As per the second estimate, real GDP grew one percent – lower than post-Great Recession average of 2.1 percent and substantially below long-term average of 3.2 percent going back to 2Q47.
Also on Friday, corporate profits for the fourth quarter come out. We already know from the Fed’s Z.1 release that profits before tax adjusted for inventory and depreciation fell 10.5 percent y/y to $1.91 trillion (SAAR). Profits peaked at $2.16 trillion in 3Q14.
Five FOMC members are scheduled to speak during weekdays.
Currently net long 42.3k, up 5.5k.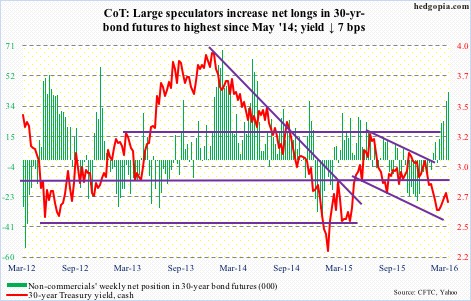
Crude oil: Spot West Texas Intermediate crude broke out of first $38 and then $40. A couple of things helped.
First, until Tuesday, spot WTI was unchanged for the week. Then came the FOMC statement, and the resulting dollar slump. This was a big tailwind for commodities, including oil.
Second, market continues to focus on the positives.
In the week ended March 11th, gasoline stocks dropped another 747,000 barrels to 249.7 million barrels. In the past month, stocks have shrunk by nine million barrels, although from a record high.
Distillate stocks, too, fell – by 1.1 million barrels to 161.3 million barrels.
Crude imports fell by 355,000 barrels per day to 7.7 mb/d. Crude imports have fallen by 599 b/d in the past couple of weeks.
And, crude production fell by 10,000 b/d to 9.1 mb/d. Production reached a record 9.61 mb/d in the June 5th (2015) week.
Refinery utilization fell one-tenth of a percent to 89 – a slight negative.
The biggest negative came in the form of crude stocks, which rose by another 1.3 million barrels to a record 523.2 million barrels. Inventory is now up nearly 41 million barrels in the past 10 weeks. Traders for now have decided to completely ignore this data point.
There is increasing optimism that the April 17th meeting in Doha among producers from within and outside OPEC results in output freeze.
Mid-February, Saudi Arabia and fellow OPEC members Qatar and Venezuela agreed with Russia, non-OPEC, to freeze output at January levels. Iran is not going along. Rather, it increased production by 187,800 b/d to 3.13 mb/d last month. Likewise, Saudi Arabia’s output stood at 10.23 mb/d in January. They are all trying to increase production – just in case there is a deal to freeze output.
On Friday, spot WTI was less than a percent away from testing the 200-day moving average, and was rejected. Potentially an important reversal near-term.
In the meantime, XLE, the SPDR energy ETF, tagged its 200-DMA on both Thursday and Friday, and looks tired.
Non-commercials continue to add net longs – now at 21-week high.
Currently net long 267.4k, up 33.2k.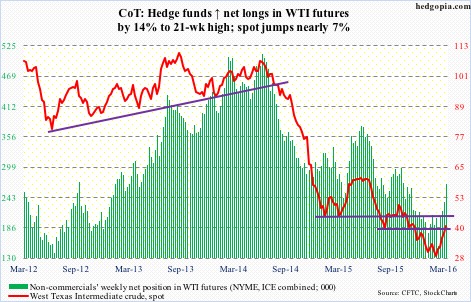
E-mini S&P 500: Some signs of FOMO (fear of missing out) are showing up. Buy-the-dips is persistent, and has worked so far. Most indicators are at extreme complacent readings.
The percent of S&P 500 stocks above 50-day moving average rose to over 93 percent. On January 20th, this dropped below 10, to nine. From one extreme to another! We know how that ended for the bears. And we know how this is going to end for the bulls.
In the week ended Wednesday last week, $4.6 billion moved into U.S.-based equity funds – first inflows in 10 weeks. Turns out it was just a one-hit wonder. This week, there were $2.1 billion in outflows (courtesy of Lipper). With this, since the week ended February 10th, nearly $10 billion has been withdrawn. (The S&P 500 bottomed on February 11th.)
The Lipper data also shows that $35.9 billion left money-market funds this week. This jibes with the ICI data showing a decline of nearly $40 billion in money-market funds in the same week. Not much made it into stocks, as Lipper shows.
That said, SPY, the SPDR S&P 500 ETF, has been attracting funds of late – $3.1 billion in the week ended Wednesday, and $2.4 billion since the S&P 500 broke out of 1950 on March 1st (courtesy of ETF.com).
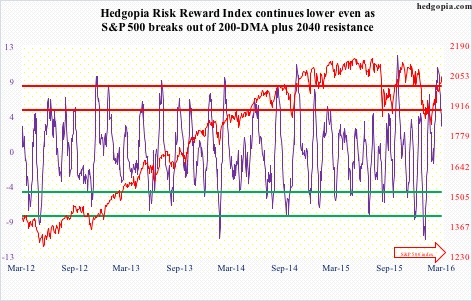
This week, the S&P 500 took care of 200-DMA, as well as 2040. Momentum is intact, but reversal risk is very high.
Currently net short 205.9k, up 290.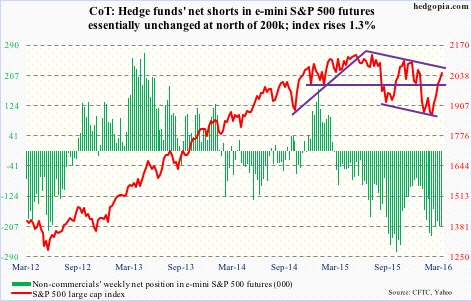
Euro: Eurozone inflation in February was revised up. In the year to February, the core rate rose 0.8 percent, versus the previous estimate of 0.7 percent. This is still below the ECB’s two-percent goal, nonetheless helped the euro rally 0.84 percent on Thursday. On Wednesday, it had already rallied one percent, thanks to the FOMC.
Mr. Draghi is probably not a happy man. After a 1.3-percent rally last week, the euro rallied another 1.1 percent this week. All that ‘shock and awe’ extra stimulus last week in vain!
The euro (112.71) is looking extended, though… rose to 113.38 on Thursday before reversing. Resistance at 114 goes back to January last year.
Currently net short 77.6k, up 5.6k.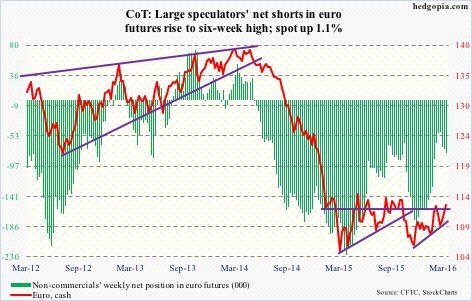
Gold: Gold bugs should be sending a big ‘thank you’ note to Ms. Yellen. Until Tuesday, spot gold looked ready to unwind the extreme overbought conditions it was in. A breakout retest of $1180 looked imminent.
Enter the FOMC decision. The spot rallied 2.5 percent on Wednesday, but failed to add to it on Thursday, although the dollar index continued lower.
With all three major central banks just having adopted gold-friendly policy and the metal having already reacted to it, the path of least resistance continues lower.
In the week ended Wednesday, GLD, the SPDR gold ETF, lost $4.1 billion (courtesy of ETF.com). The spot has essentially gone sideways for five weeks now. GLD longs are probably losing patience.
Similarly, in the one month ended March 8th, non-commercials raised net longs from under 100,000 contracts to nearly 175,000. Spot gold has not moved. For the first time in eight weeks, these traders cut net longs this week.
Currently net long 169.5k, down 5.3k.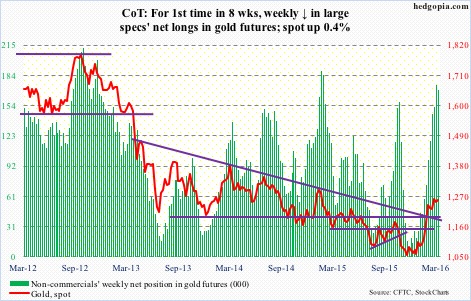
Nasdaq 100 index (mini): Broke out of 4350, but action is lethargic.
On Wednesday through Friday, the index closed right underneath 200-DMA, with a doji on Friday. The $2.3 billion that moved into QQQ, the PowerShares Nasdaq 1000 ETF, in the week ended Wednesday is probably betting that the average will be taken care of. The inflows followed defense of 50-DMA on Thursday last week. Failure to take out 200-DMA risks these inflows leave briskly.
Currently net short 4.4k, down 11.2k.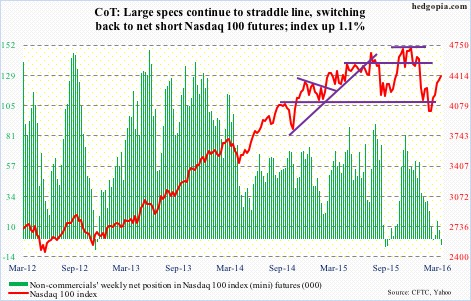
Russell 2000 mini-index: Until Friday, the Russell 2000 went sideways for two weeks. IWM, the iShares Russell 2000 ETF, attracted $1.3 billion during the period (courtesy of ETF.com). These longs are not making much money.
Friday was a saving grace, with the index feebly breaking out of the two-week congestion.
Non-commercials are not convinced this will continue. Net shorts remain very high, with last week at a 17-month high.
Currently net short 63.5k, down 2.7k.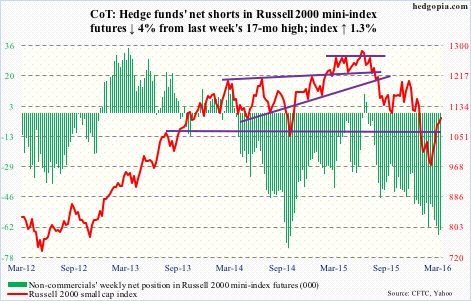
US Dollar Index: In the currency land, what the dollar index experienced on Wednesday and Thursday can be described as shellacking – down two percent.
Support at 97 is gone. In fact, on Wednesday – the FOMC decision day – the index tagged that resistance, which is where 200-DMA lies as well, and was vigorously denied.
Non-commercials continue not to show any love. They cut net longs to the lowest since February 2014.
That said, daily momentum indicators are grossly oversold.
Currently net long 17.5k, down 8.9k.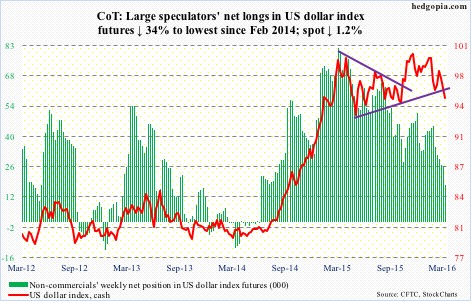
VIX: The August 2015 rising trend line, which otherwise was providing support, was broken on Wednesday, and spot VIX lost three points in a couple of sessions.
Ray of hope for volatility bulls: Friday produced a doji at the lower Bollinger Band.
As well, the VIX-to-VXV ratio closed the week at 0.78, matching the mid-March low last year. Also, this was the first time the ratio dropped into oversold zone in three months. Time to rally!
Currently net long 10.3k, down 10.8k.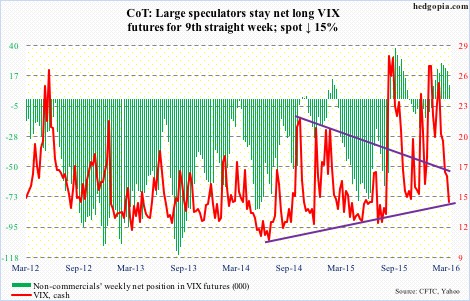
Hedgopia Risk Reward Index