The following are futures positions of non-commercials as of May 3, 2016. Change is week-over-week.
10-year note: Last week, the Bank of Japan shocked markets by not adding to its stimulus program. The yen jumped 2.4 percent. This week, the Reserve Bank of Australia did the same by lowering its cash-rate target by 25 basis points to a new low of 1.75 percent. The Australian dollar fell nearly two percent.
Here at home this week, two regional Fed presidents, both non-voting FOMC members, hinted that the June 14-15 meeting was alive. Could the Fed pull off a surprise of its own?
Dennis Lockhart, the Atlanta Fed president, said a rate hike in June was “a real option.” He said he was awaiting more data to help him make up his mind, saying the market seemed to be underestimating the odds of a rate increase in June.
Then, John Williams, the San Francisco Fed president, said he wanted to see inflation on the “right trajectory” moving toward two percent and continued “good job gains.” He said he pays more attention to the labor market, which has continued to improve, rather than the weak GDP in 1Q16.
April created 160,000 non-farm jobs, with downward revisions in prior two months. This pretty much takes June off the table.
Further, there is a bigger excuse for the Fed not to move in June. The “Brexit” vote in the U.K is slated for June 23rd. And the Fed, in addition to its dual mandate of maximum employment and price stability, is equally worried about global risks.
Then we have U.S. elections in November.
Currently net short 82k, up 18.2k.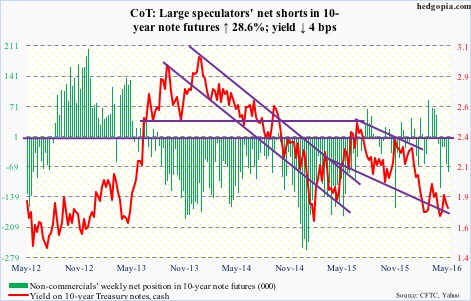
30-year bond: Major economic releases next week are as follows.
Tuesday brings the NFIB optimism index for April. March was 92.6, down three-tenths of a percent month-over-month. The cycle peaked in December 2014 at 100.3, the highest since 100.7 in October 2006. Comp plans were 16 in March, down from 21 last December, matching the high 11 years ago.
Also on Tuesday comes out JOLTS for March. Job openings were down 159,000 m/m in February to 5.45 million. The cycle peaked last July at 5.79 million.
On tap for Friday are retail sales (April), PPI-FD (April), and the University of Michigan’s consumer sentiment (preliminary May).
Retail sales fell 0.3 percent m/m in March to annualized $446.9 billion – the lowest since last September. Year-over-year, they fell 1.8 percent in March – the lowest growth rate since last November.
Producer prices fell 0.1 percent in March after dropping 0.2 percent in February. In the 12 months through March, the PPI dropped 0.1 percent after remaining unchanged in February. Core PPI was unchanged in March after inching up 0.1 percent in February. In the 12 months through March, it was up 0.9 percent after rising by a similar amount in February.
Consumer sentiment fell two points m/m in April to 89. This was the fourth straight m/m decrease. At 98.1, the cycle high was reached in January 2015 – an 11-year high.
Five FOMC members are scheduled to speak during weekdays.
Currently net long 45k, down 3.2k.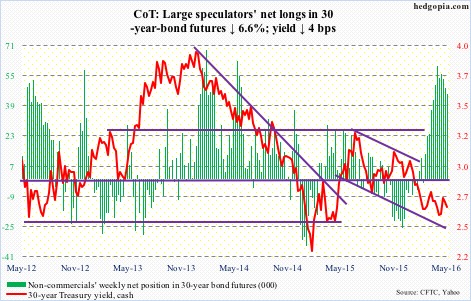
Crude oil: Wildfire in Canada’s oil-sands district helped crude-oil prices. So did tensions between rival factions in Libya. Although not enough to stop spot West Texas Intermediate crude from dropping 2.9 percent – its first negative week in five.
The long-legged doji last Friday proved prescient.
That said, bulls should take heart from the fact that broken-resistance-turned support at $43.50 is intact. With weekly conditions as overbought as they are, one wonders how long that support holds.
Fundamentally, for the week ended April 29th, U.S. crude inventory continued to rise, up another 2.8 million barrels to 543.4 million barrels. In the past 17 weeks, stocks have gone up by 61.1 million barrels, and are inching ever closer to the all-time high 545.2 million barrels in October 1929.
Gasoline stocks, too, rose – for the second week running – by 536,000 barrels to 241.8 million barrels. And last but not the least, crud imports rose 110,000 barrels per day to 7.7 million b/d.
On the positive side, crude production continued to slide, this time dropping 113,000 b/d to 8.8 mb/d. This was the fourth consecutive sub-nine mb/d. Production peaked at 9.61 mb/d in the June 5th week last year.
As well, distillate stocks fell by another 1.3 million barrels to 157 million barrels. In the past three weeks, stocks have declined by 6.5 million barrels. And, refinery utilization rose 1.6 percentage points to 89.7.
Currently net long 318.9k, down 10.9k.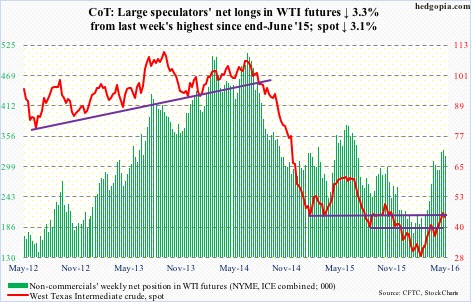
E-mini S&P 500: It took 13 sessions for the S&P 500 index to travel from the upper Bollinger Band to the lower bound, giving back 3.4 percent in the process.
This is also a spot where the bulls needed to put their foot down. The 50-day moving average approximates the lower Bollinger Band. The last time the average was tested from above was right before the collapse in stocks in late December last year. A failure to save it would be a big tell – that selling is accelerating. On Friday, it was breached intra-day, but closed above.
Outflows accelerated this week. In the week ended Wednesday, a whopping $11.2 billion left U.S.-based equity funds (courtesy of Lipper). This was the largest weekly withdrawal since the week ended January 6th ($12 billion). Since February 10th, nearly $28 billion has now been redeemed. Money is leaving, taking advantage of the rally.
Ditto with SPY, the SPDR S&P 500 ETF. In the week ended Wednesday, all five sessions witnessed outflows, totaling $6.4 billion (courtesy of ETF.com).
This is precisely not what the bulls were hoping to see. Momentum is at risk of slowing down/reversing, and if weekly indicators take over, there is plenty of unwinding left of overbought conditions.
Currently net long 10.1k, up 8.6k.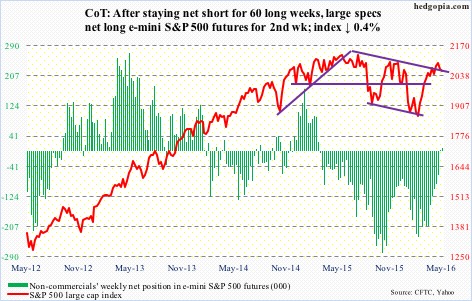
Euro: The European Commission forecast weaker growth in the Eurozone this year – from 1.7 percent in February to 1.6 percent. Last year, the economy expanded 1.7 percent. Next year, it expects growth of 1.8 percent, down from prior forecast of 1.9 percent.
More worrisome, as far as the ECB and its attempt to ignite inflation is concerned, it is seen to rise just 0.2 percent this year, lower than previous prediction of 0.5 percent. In 2017, inflation is expected to rise 1.4 percent, versus previous forecast of 1.5 percent. This is still below the ECB’s inflation target of close to two percent.
On Monday, the euro broke out of resistance at 114-114.50, which goes back to January last year, but reversed hard in the very next session. Both daily and weekly indicators are now grossly overbought. The currency is literally sitting on that resistance, but odds favor it weakens going forward, with a shooting star on a weekly chart. It is a bearish reversal pattern, which suggests it was a healthy advance at the beginning – particularly having come in the wake of a breakout – but bears’ ability to force prices down raises the yellow flag.
Currently net short 23.6k, down 16k.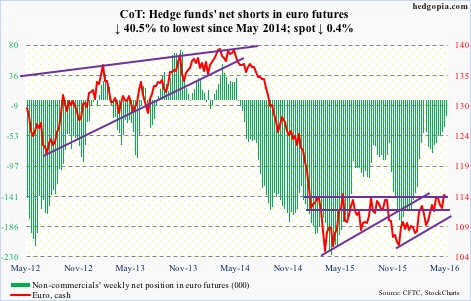
Gold: Last Friday, spot gold broke out of the range it had been in since February 11th. That breakout took place at 1,270-ish. The very next session – that is, this Monday – produced a gravestone doji, which, having come after a long uptrend and a couple of long white candles, can signal a potential bearish reversal.
The metal lost 0.4 percent for the week, and produced a long-legged doji.
The afore-mentioned breakout did attract funds into GLD, the SPDR gold ETF, or maybe it was the other way round – meaning the flows helped gold break out. In the week ended Wednesday, $944 million moved into the ETF.
Coming into the week, non-commercials already had heavy net long exposure, and they added more. Holdings are now at a record high.
Although the afore-mentioned breakout is intact on spot gold, the risk facing these traders, as well as GLD longs, is if the afore-mentioned gravestone doji is a warning shot across the bow of gold bugs.
Currently net long 271.6k, up 50.8k.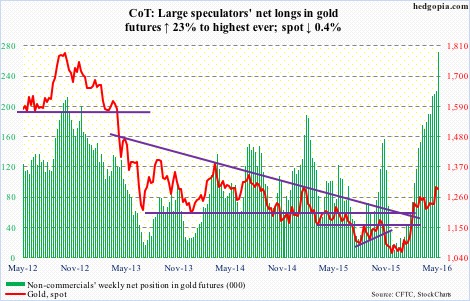
Nasdaq 100 index (mini): Apple (AAPL) is teetering on the brink of a make-or-break level. Good luck to QQQ, the PowerShares Nasdaq 100 ETF, investors if the stock breaks 92. This support goes back to June 2014, or even September 2012. AAPL makes up 11.7 percent of the ETF.
Last week, the Nasdaq 100 lost both its 50- and 200-day moving averages, and sat on crucial support at 4350. This week, it lost the latter support, although Friday saw quite an intra-day reversal.
On a daily basis, technicals are oversold. Should a rally ensue near term, 4414 is where both 50- and 200-day averages converge. That said, it is a tough road ahead should weekly indicators take over.
Particularly so if flows do not cooperate. In the week ended Wednesday, a hefty $2.5 billion came out of QQQ, following $97 million in inflows in the prior week.
Currently net long 9.3k, down 27.5k.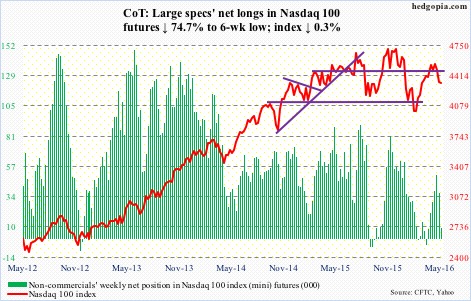
Russell 2000 mini-index: During the January collapse in U.S. stocks, the Russell 2000 fell out of a rising trend line drawn from March 2009. After a February hammer reversal, March and April were positive months, with the April high kissing the belly of that trend line but getting rejected.
In the meantime, the index this week lost dual support at 1120-ish – horizontal line going back to September 2013 as well as two-month channel. The $686 million that came out of IWM, the iShares Russell 2000 ETF, in the week ended Wednesday probably played a role in this.
Resistance working and support failing, that is not a good combo.
The index is currently trapped between 50- and 200-day moving averages, with the former about to go flat and the latter declining. There is decent support at 1080. On Friday, it dropped to 1101.57 before reversing.
Currently net short 49k, down 6.5k.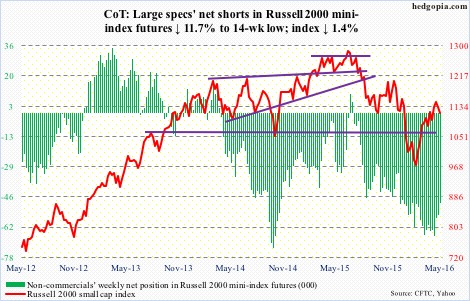
US Dollar Index: Just when it looked like the dollar index was breaking down came a weekly hammer reversal candle. The week started with Monday continuing to extend last week’s breakdown, only to see a major Tuesday reversal. With rally the next three sessions, it is back above 93.50, which was lost last week.
If this week’s action is a precursor to an imminent rally, there is a lot of repair work that needs to be done. The 50-day moving average is still dropping. Shorter-term moving averages can at least begin to go flat, unless the dollar index comes under renewed pressure.
Non-commercials continue to cut back net longs, which are now the lowest since June 2014.
Currently net long 9.2k, down 2.2k.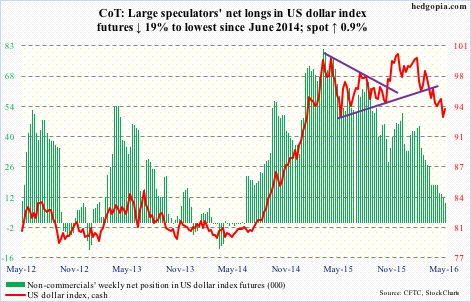
VIX: The good: there is a 10/20 crossover (moving average) on spot VIX, with plenty of room to run on a weekly chart. The bad: daily indicators are now overbought. And the ugly: it is struggling to stay above its 50-day moving average, with 16-16.50 acting as a ceiling. On Friday, that resistance was in play again, with the spot unable to save the 50-day.
The VIX-to-VXV ratio fell back to low 0.80s after a mid-0.80s reading last week. With this, in seven of the last eight weeks, the ratio has been in high 0.70s to low 0.80s. Compressed spring!
Currently net short 77.4k, up 1.6k.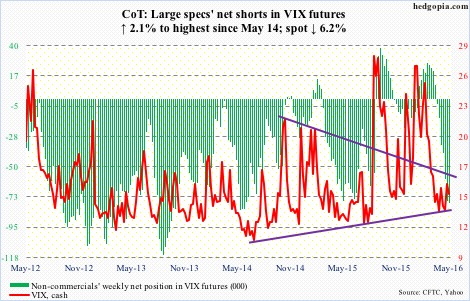
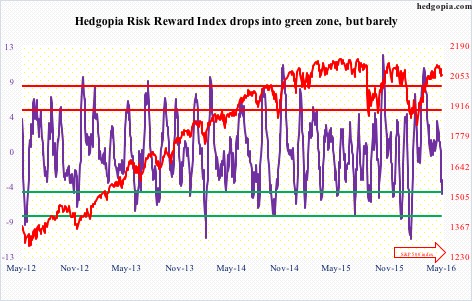
Hedgopia Risk Reward Index