The following are futures positions of non-commercials as of May 24, 2016. Change is week-over-week.
10-year note: Was that a yay or nay from Janet Yellen, Fed chair?
In an interview at Harvard University on Friday, she said that an interest rate hike would probably be “appropriate” in the coming months.
Her comments came in the wake of a couple of weeks of hawkish jawboning from several regional Fed presidents, both voting and non-voting. She has been a dove up until now, and her message yesterday was nowhere near as hawkish as her FOMC colleagues’, although she did imply a hike was appropriate.
Post-interview, fed funds futures were pricing in 34-percent odds of a hike in June, up from 28 percent a day ago. July odds went up from 51 percent to 59 percent. Unless the May jobs report is a huge disappointment next week, looks like markets are thinking July is a go.
TLT, the iShares 20+ year Treasury bond ETF, cannot decide which way to go, hugging the 50-day moving average the past eight sessions.
Currently net short 80.3k, down 32.1k.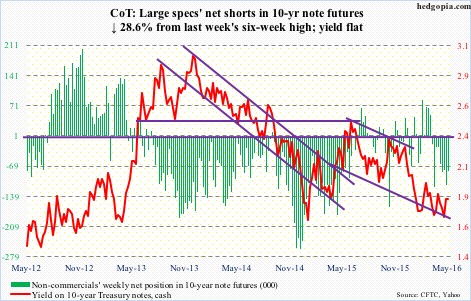
30-year bond: Major economic releases next week are as follows. (Monday is closed for observance of Memorial Day.)
April’s personal income numbers are published on Tuesday. This series includes the personal consumption expenditures index, which is the Fed’s favorite measure of consumer inflation. In March, it increased at an annual rate of 1.56 percent, down from 1.72 percent in the prior month. The last time it grew at two percent was four years ago.
Also on Tuesday comes out the S&P Case-Shiller housing price index for March. Nationally, prices rose at 5.3 percent annually in February, and have risen in the four-to-five percent range since July 2014.
May’s ISM manufacturing index is reported on Wednesday. April saw a month-over-month drop of a point to 50.8. Prior to this, the index languished sub-50 for five straight months from October last year through February. New orders dropped 2.5 points in April to 55.8.
The ISM non-manufacturing index for May is published on Friday. April rose 1.2 points to 55.7. Similarly, new orders rose 3.2 points to 59.9 – a six-month high.
Friday also brings employment numbers (May) and factory orders (April, final).
April saw gains in non-farm payroll of 160,000, lower than the 2016 average of 192,000. In 2015, the monthly average was 229,000, and in 2014 251,000. Average hourly earnings of private-sector employees rose at an annual rate of 2.5 percent in April. The last time these earnings grew at north of three percent was in April 2009.
The advance report on durable goods for April was reported on Thursday. Orders for non-defense capital goods ex-aircraft – business capex proxy – were down 0.8 percent m/m – third consecutive drop. Year-over-year, orders fell five percent – sixth straight decline, and down in 15 out of last 16 months.
Two FOMC members are scheduled to speak during weekdays.
Currently net long 72.3k, up 15.2k.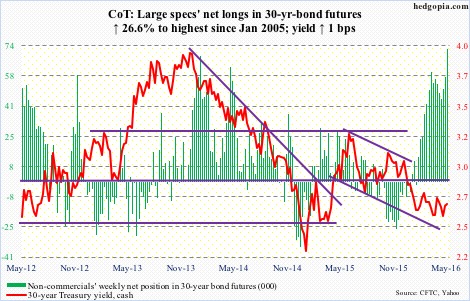
Crude oil: OPEC meets on June 2nd (Thursday). Crude oil has rallied strongly into the meeting. The likes of Angola, Nigeria, and Venezuela have suffered a lot from the drop in oil. But they don’t carry much weight within the cartel.
It is probably unrealistic to expect Saudi Arabia to deviate from its market-share goals. As is to expect Iran to agree to a production cutback. In fact, the latter on Sunday did say it had no plan to halt a rise in production and exports. Its crude exports, excluding gas condensates, are two million barrels per day currently and would reach 2.2 mb/d by the end of summer.
Markets currently are focused on the positives.
For the week ended May 20th, U.S. crude stockpile dropped by 4.2 million barrels to 537.1 million barrels. Inventory is now down 6.3 million barrels from the April 29th high of 543.4 million barrels, which was the highest since the all-time high 545.2 million barrels in October 1929.
Crude imports fell, too, down 362,000 barrels per day to 7.3 million b/d.
Crude production fell by another 24,000 b/d, to 8.77 mb/d. This was the 11th straight weekly drop and seventh sub-nine mb/d. Production peaked at 9.61 mb/d in the June 5th week last year.
Also declining was distillate inventory, down 1.3 million barrels to 150.9 million barrels. This was a sixth straight weekly drop.
Gasoline stocks, however, were up two million barrels to 240.1 million barrels. Also, refinery utilization decreased eight-tenths of a percent to 89.7 percent.
For the week, spot West Texas Intermediate crude was up another 2.2 percent – its seventh positive week in the past eight. Extended, yes, but momentum is intact, with the crude rallying along its upward-sloping 10-day moving average. It needs to drop north of five percent to go test its 20-day moving average.
Currently net long 365.1k, down 6k.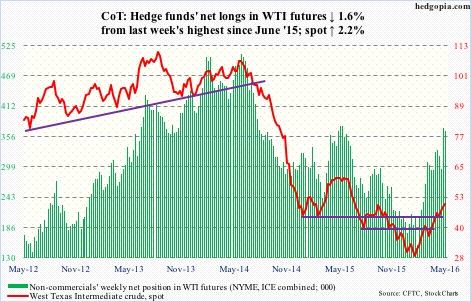
E-mini S&P 500: With one session to go, the old adage ‘sell in May and go away’ has not quite panned out. The S&P 500 is up 1.6 percent for the month… was down as much as 1.9 percent through the May 19th intra-day low. But bulls stepped up, defending crucial support at 2040. This is a positive side to the story.
On the negative side of things include continued failure of the current rally to excite retail. Another $4.8 billion came out of U.S.-based equity funds in the week ended Wednesday (courtesy of Lipper). Just this month, $26 billion has come out, and north of $42 billion since the February 10th week.
Along the same lines, $2.4 billion left SPY, the SPDR S&P 500 ETF, in the week ended Wednesday (courtesy of ETF.com). Tuesday saw the ETF surge 1.3 percent, but the session only attracted $51.4 million, but Wednesday did attract $647 million.
With the 2.3-percent rally this week, the S&P 500 once again finds itself right on the May 2015 trend line. On April 20th, a breakout attempt was vehemently rejected, resulting in the subsequent sell-off. Plenty of buying power has been expended in bringing the index up against this resistance, with daily technicals now overbought.
Currently net long 83.4k, up 92.3k.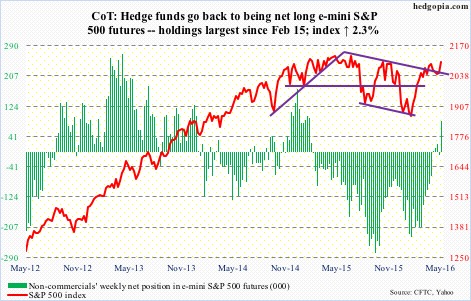
Euro: European finance ministers agreed on Wednesday to free up another €10.3 billion in loans for Greece. The nation already owes its creditors more than €300 billion, or some 180 percent of its GDP. However, the latest deal only provides a loose roadmap for some sort of debt relief.
Ahead of the meeting, the IMF called for European creditors to forgo any Greek debt repayments until 2040 and to fix interest rates at 1.5 percent over that time. The IMF telling the eurogroup what to do on their debt would probably not go down well particularly in Germany. That said, debt relief in one form or another is just a matter of time.
This week’s loan deal in normal circumstances would be euro positive. That said, weekly conditions were overbought, with the currency sitting on the lower bound of a December 2015 rising channel. There are decent odds this support does not give way, at least not now. On a daily chart, the euro is oversold, and is literally sitting on its 200-day moving average.
Currently net short 37.9k, up 15.3k.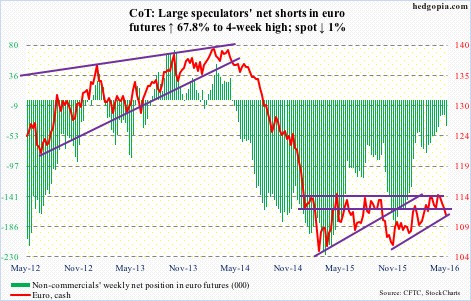
Gold: Spot gold just had a weekly bearish MACD crossover. The metal dropped three percent for the week, with weekly momentum indicators already under pressure and approaching/at the median. In nearly four months now, there probably has not been a better opportunity for gold bugs to step up to the plate.
Spot gold is at the lower bound of a nearly four-month range, at the lower Bollinger Band and is grossly oversold on a daily chart.
Inflows into GLD, the SPDR gold ETF, have not stopped. In the week ended Wednesday, it attracted $516 million (courtesy of ETF.com).
However, the wild card continues to be non-commercials. Three weeks ago, net longs were the highest ever, even as gold has only been marking time the past four months. The risk is if and when these traders lose patience. This week, they reduced holdings by 22 percent. Gold bugs surely hope this is not a trend.
Currently net long 206.6k, down 59.7k.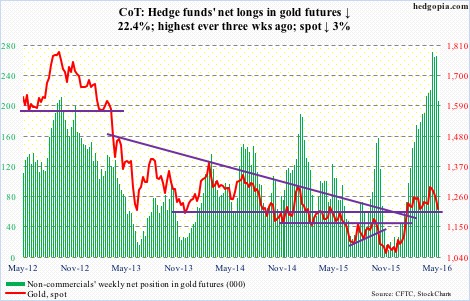
Nasdaq 100 index (mini): Apple (AAPL), which makes up 10.7 percent of the index, surged 5.4 percent in the week, merely 1.1 percent from its 50-day moving average. In an ideal world, it has a shot at its 200-day moving average ($105.67), which also approximates a declining trend line from July 2015.
Realistically, the Nasdaq 100, having rallied 3.4 percent in the week and retaken the 50-day moving average, is now extended on a daily chart, helped along by inflows.
In the week ended Wednesday, QQQ, the PowerShares Nasdaq 100 ETF, attracted $318 million – $575 million on Wednesday (courtesy of ETF.com). This followed outflows of $215 million in the prior week.
Non-commercials are piling on.
Currently net long 30.2k, up 37.8k.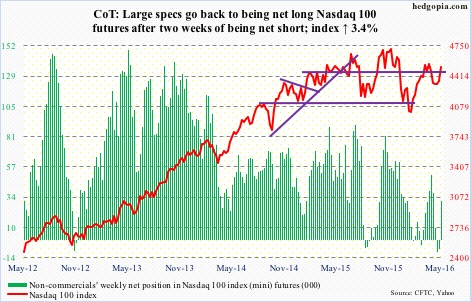
Russell 2000 mini-index: The 2.2-percent Tuesday jump broke out of both 50- and 200-day moving averages. The Russell 2000 has also broken out of a declining trend line drawn from June 2015. Support at 1090-1120 has been defended. All positives!
Further, in the week ended Wednesday, $1.4 billion moved into IWM, the iShares Russell 2000 ETF (courtesy of ETF.com). This follows outflows of $1.9 billion in the prior week.
That said, the index is still below the rising trend line from March 2009, which was broken in January. This is major resistance.
The daily oversold conditions that the index was in has now been unwound. And RVX, the Russell 2000 volatility index, after it was rejected at its 200-day moving average, has quickly dropped to the lower Bollinger Band, and to the bottom of a six-month range.
Low-hanging fruits are running out. That said, non-commercials are helping, as they continue to get squeezed.
Currently net short 37.1k, down 8.7k.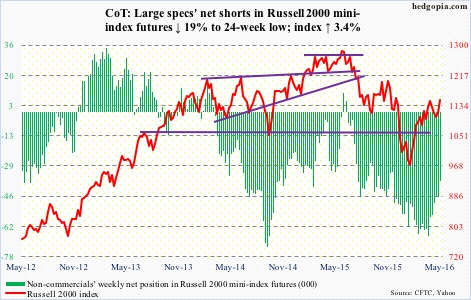
US Dollar Index: The Friday intra-day high of 95.77 kissed a downward-sloping trend line drawn from January this year. This took place as the US dollar index rallied 4.2 percent intra-day between May 3rd and 27th, with daily conditions grossly overbought. The Friday high also nearly retraced 50 percent of the January 21st-May 3rd 8.1-percent drop – another reason for the rally to potentially pause/reverse.
That process likely has begun. The 50-day moving average is flat to slightly rising, which likely gets tested in the days to come.
In the meantime, non-commercials continue to act hesitant to add to net longs, and that is an issue. Net longs are near two-year lows of three weeks ago. However, holdings are pre-Yellen comments on Friday. Next week’s will reveal these traders’ true intention.
Currently net long 11.2k, up 732.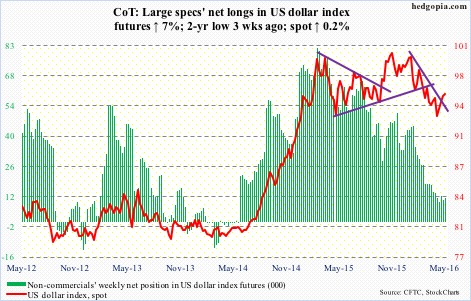
VIX: Only six sessions ago, spot VIX tried to take out resistance at 16-17, but was rejected by a gravestone doji, and since quickly shed 4.5 points.
Currently, VIX is at the lower Bollinger Band, which also approximates the bottom end of the range it has been in for years.
If it goes sideways to slightly down in the next couple of sessions, daily conditions drop into oversold zone, raising the odds of a rally.
Medium-term, the VXST-VIX-VXV-VXMT curve further steepened on Friday, with the spread between VXST and VXMT nearly nine points. Quite a contango! Markets are pricing in higher volatility within the next six months.
Currently net short 85.3k, down 9.5k.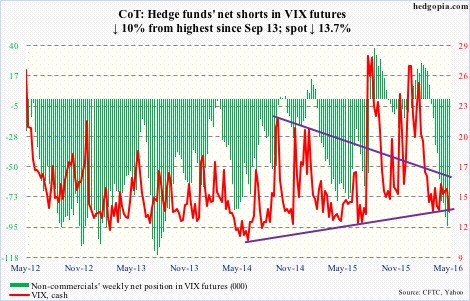
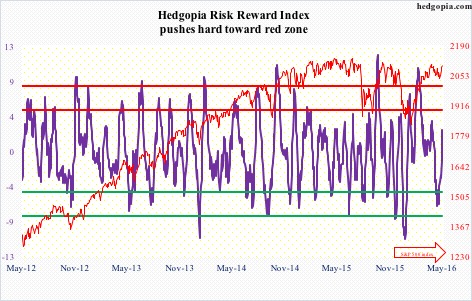
Hedgopia Risk Reward Index