The following are futures positions of non-commercials as of July 19, 2016. Change is week-over-week.
10-year note: If you repeat something often enough, it becomes the truth. So the saying goes.
Why bring this up? There is a sudden uptick in discussion of helicopter money, which a central bank uses to essentially fund government spending.
At the moment, no policymaker is seriously vouching for it.
Haruhiko Kuroda, BoJ governor, said on a prerecorded BBC show from June that there is “no need and no possibility for helicopter money.” Back in April, ECB officials made it clear it is not on the table. That said, in the middle of June, Janet Yellen, Fed chief, did say it may have role in extreme situations.
Here is the thing. Repeat it often enough, people may eventually come to believe it. Markets start pricing it in. And policymakers may oblige.
From ZIRP to QE to NIRP to now helicopter money. Keep throwing mud at the wall, some of it will stick. At least that is the hope.
Currently net long 109.4k, down 22k.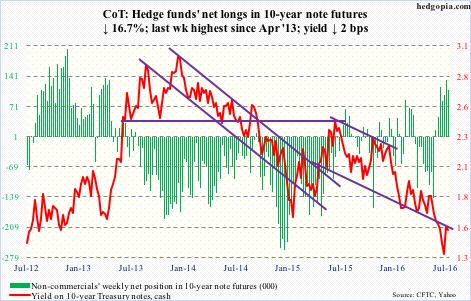
30-year bond: Major economic releases next week are as follows.
On Tuesday, FOMC meeting begins, and concludes the next day. There is no press conference scheduled. After this, there will be three more left this year – September 20-21, November 1-2, and December 13-14, with press conference scheduled for September and December.
Also on Tuesday comes out the S&P/Case-Shiller home price index (May) and new home sales (June).
Home prices, on a national level, increased five percent year-over-year in April, and have risen in the four to five percent range for nearly two years now.
New home sales declined six percent month-over-month to a seasonally adjusted annual rate of 551,000 units in May. April’s 586,000 units were the highest since February 2008.
Wednesday brings durable goods orders (June, advance) and the pending home sales index (June).
Orders for non-defense capital goods ex-aircraft dropped 3.8 percent y/y in May to a seasonally adjusted annual rate of $62.3 billion. This was the 7th consecutive y/y drop, and 16th in the last 17 months. Orders peaked in September 2014 at $70.7 billion.
Pending home sales dropped 3.7 percent m/m in May to 110.8. April’s 115 was the highest since March 2006. This metric correlates well with existing home sales.
On Friday, we get GDP (2Q16, advance), ECI (2Q06), and the University of Michigan’s consumer sentiment (July, final).
Real GDP grew 1.1 percent in 1Q16. Growth has been sub-par, with the average since 3Q09 of 2.1 percent versus 3.2 percent going back to 2Q47.
Private-sector compensation has struggled to grow, with 1Q16 growth of 1.8 percent y/y. Total comp also increased at less than two percent in the prior three quarters. Wages & salaries did a little better, growing at two percent in 1Q16, and benefits 1.2 percent.
Consumer sentiment fell four points m/m to 89.5 in July. The cycle high of 98.1 was reached in January last year – an 11-year high.
Currently net long 91.8k, down 12.1k.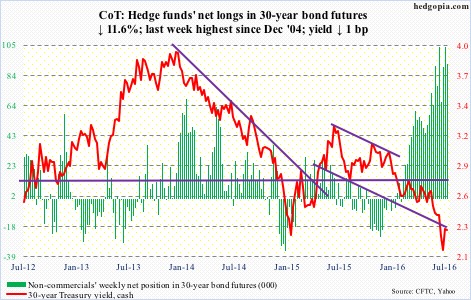
Crude oil: U.S. crude stocks continued to decline – down 2.3 million barrels to 519.5 million barrels in the July 15th week. They are now down 23.9 million barrels from the April 29th high of 543.4 million barrels, which was the highest since the all-time high 545.2 million barrels in October 1929.
Distillate inventory fell as well – by 214,000 barrels to 152.8 million barrels.
Refinery utilization rose nine-tenths of a point to 93.2 percent – the highest since November 27th last year.
Gasoline stocks, however, increased 911,000 barrels to 241 million barrels – an 11-week high.
Production rose as well – by 9,000 barrels per day to 8.49 million b/d. This was the second straight week-over-week increase after production dropped to 8.43 mb/d two weeks ago. Production peaked at 9.61 mb/d in the June 5th week last year.
Crude imports rose by 293,000 b/d to 8.13 mb/d.
During the five sessions prior to Friday, spot West Texas Intermediate crude traded around the declining 10-day moving average before pulling away yesterday. Daily conditions are oversold, but the weekly chart has downside risk still, with support at $42.50-$43. The spot just had a bearish MACD cross-under.
Currently net long 299.3k, down 10.5k.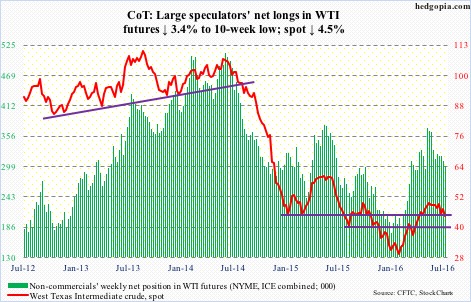
E-mini S&P 500: Was it just a blip? Last week’s inflows into U.S.-based equity funds, that is. Looks that way. Early last week, the S&P 500 broke out; by Wednesday, these funds attracted $7.7 billion (courtesy of Lipper). This was a first positive week in 11 weeks. This week, the prevailing trend exerted itself, with outflows of $2.8 billion. Since the week ended June 29th (the S&P 500 reversed on the 27th), $3.2 billion has been redeemed.
SPY, the SPDR S&P 500 ETF, shows a similar trend. In the week ended Wednesday, $1.1 billion left the ETF. This was post-breakout. In the prior two weeks, $12.9 billion came in cumulatively (ETF.com).
For the breakout to hold, and/or build on it, flows need to cooperate. This week’s pattern is not encouraging. Particularly so as the index remains grossly overbought on a daily basis. Weekly indicators are now overbought as well.
Currently net long 146.2k, up 75.6k.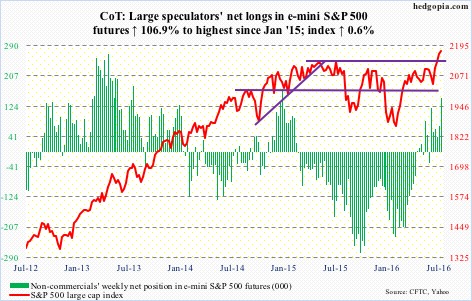
Euro: For the first time since the UK’s brexit vote, the ECB met this Thursday, and decided to leave policy on hold.
As usual, Mario Draghi, ECB president, stated that the governing council was open to, if the need be, to providing more stimulus.
The bank is already buying around €80 billion a month of private and public debt, and has cut the benchmark interest rate to a record low of minus 0.4 percent. The balance sheet has grown from €2.04 trillion in September 2014 to €3.13 trillion in June. Any room for more stimulus?
Post-ECB meeting on Thursday, the euro yawned, with a long-legged doji. Wednesday was a doji as well. On a daily basis, momentum indicators are oversold, Bollinger bands are narrowing.
Currently net short 99.9k, up 12.2k.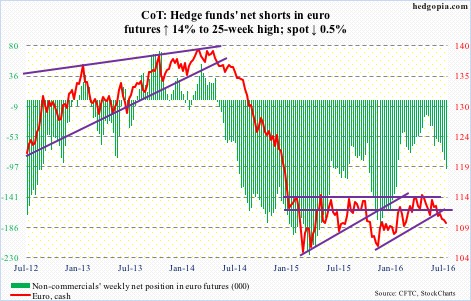
Gold: Spot gold on Thursday found support at 1,300-plus/ounce, which goes back to January 2011. Near-term notwithstanding, the metal’s weekly chart seems to want to go lower. The point of interest remains $1,260-$1,270, which represents breakout retest.
For the second week running, GLD, the SPDR gold ETF, failed to ignite interest. In the week ended Wednesday, it lost $1.2 million, after losing $753 million in the prior week.
Non-commercials’ net longs reached the highest two weeks ago, and have since been down back-to-back.
Currently net long 285.9k, down 11.6k.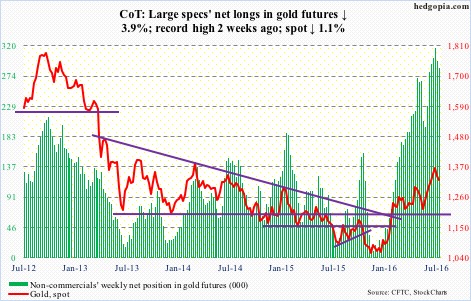
Nasdaq 100 index (mini): The Friday high came within 1.5 percent of the all-time high reached in December last year. The index continued to rally this week – up 1.7 percent and up for four straight weeks. Daily and weekly technicals continue to remain extended.
Flows into QQQ, the PowerShares Nasdaq 100 ETF have always been a suspect, and this was evident this week. After inflows of $1.2 billion in the prior week, $510 million left in the week ended Wednesday (courtesy of ETF.com).
Currently net long 96.3k, up 14k.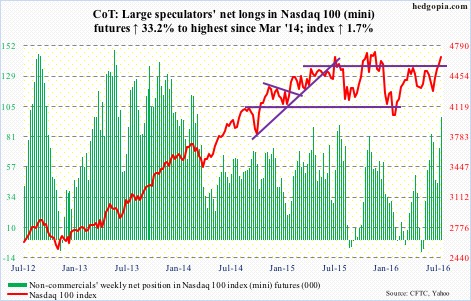
Russell 2000 mini-index: It has been a while since U.S. small-caps reached a new high. The Russell 2000 small cap index (1212.89) peaked in June last year at 1296, and has been going sideways since March 2014.
This is even as both the S&P 500 and Dow industrials have broken out to fresh new highs. Since March 2014, the Russell 2000 has been steadily underperforming the S&P 500, with the ratio between the two charting a ‘lower highs, lower lows’ pattern.
Makes you wonder if a breakout, even if comes to pass, would stick.
In the week ended Wednesday last week, IWM, the iShares Russell 2000 ETF, attracted $1.9 billion. That was not enough to push the index past the aforementioned resistance. This week, $221 million left the ETF. Year-to-date, the index has rallied 6.5 percent, with the ETF only attracting $838 million.
Non-commercials, however, have helped, as they continue to get squeezed.
Currently net short 17.6k, down 12.6k.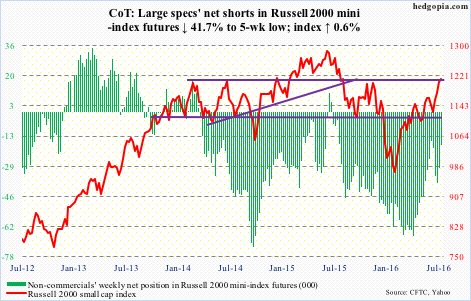
US Dollar Index: Breaks out of the sideways pattern it was in for 16 straight sessions, during which it essentially hugged the 200-day moving average. It broke out on Tuesday.
As mentioned earlier, the FOMC meets next week. The dollar index is surely not anticipating a move next week, but probably needs hawkish language in the post-meeting statement for this rally to continue. Its daily chart is way overbought. Weekly is less so, but remains overbought.
Non-commercials did have time to react to the afore-mentioned breakout, but essentially did nothing. In the past five weeks, they have gradually added to net longs, but nothing major.
Currently net long 14.5k, up 542.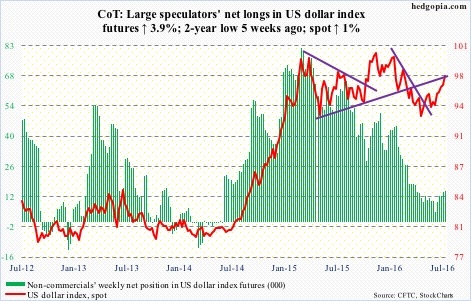
VIX: Spot VIX stayed under 13 in the past seven sessions, twice under 12. The last time it traded under 12 was in August last year. In fact, back then it briefly went sub-11, right before surging.
This week, VIX did break nine-month support at just under 13, but longer-term support at just under 12 has held – so far. On a daily basis in particular, the spot is way oversold.
This is reflected in the VIX-to-VXV ratio, which has remained in oversold territory in the past four weeks, with two of them in the low 0.80s and two in the mid to high 0.70s. It closed the week at 0.76 – the lowest since August 2012. There is a lot of unwinding left in this thing. Ditto with the volatility curve.
The VXST (nine days), VIX (30 days), VXV (three months), VXMT (six months) curve is in steep contango, completely reversing the steep backwardation it was in on June 24th. Markets are expecting higher volatility in the outer months.
Currently net short 66.7k, up 9.7k.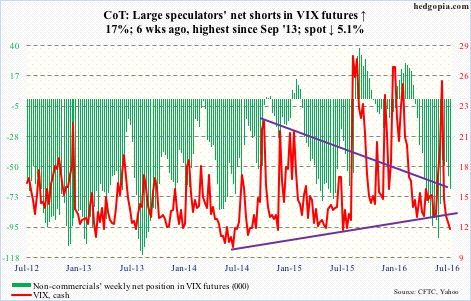
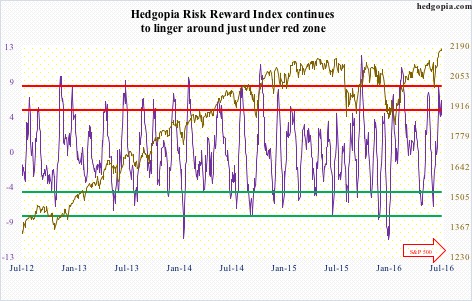
Hedgopia Risk Reward Index