The following are futures positions of non-commercials as of August 16, 2016. Change is week-over-week.
10-year note: One more prominent central banker this week seemed to throw his hands up in the air.
John Williams, San Francisco Fed president, in a paper urged central banks to consider new tools taking into account slower economic growth and lower neutral interest rates – pretty much implying that the existing tools are not working.
Last week, Graeme Wheeler, Reserve Bank of New Zealand governor, while cutting the benchmark interest rate by 25 basis points to a record low two percent, alluded that some central banks have run out of ammo.
Also last week, the Bank of England struggled to find enough bonds to buy.
Here in the U.S., after nearly eight years of zero-bound Fed funds rate and three iterations of quantitative easing, economic growth remains sub-par. Central bankers are frustrated.
Mr. Williams’ remarks come a week ahead of the August 25-27 Jackson Hole meeting. Janet Yellen, Fed chair, did not attend in 2015, she is this year, and is set to speak on Friday. Will be interesting to watch if she echoes Mr. Williams’ sentiment. Back when she headed up the San Francisco Fed, Mr. Williams directed the bank’s research department.
Currently net long 26.6k, down 91.6k.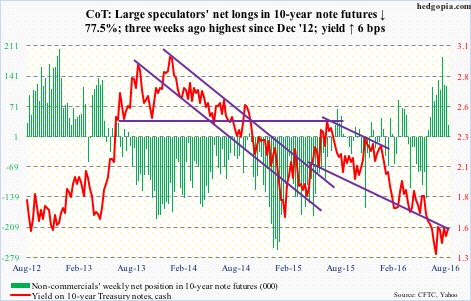
30-year bond: Major economic releases next week are as follows.
On Tuesday, new home sales for July are published. June was up 3.5 percent month-over-month to a seasonally adjusted annual rate (SAAR) of 592,000 units. This was the highest since 593,000 in February 2008.
Wednesday brings July’s existing homes sales. June rose 1.1 percent m/m to 5.57 million units (SAAR) – the highest since 5.79 million in February 2007.
The advance report on durable goods for July is scheduled for Thursday. Orders for non-defense capital goods ex-aircraft – proxy for business capital expenditures – rose 0.4 percent m/m in June to $62.4 billion (SAAR). Orders fell 3.6 percent year-over-year – eighth consecutive drop.
Also, the Jackson Hole confab begins on Thursday.
On Friday, GDP (2Q16, second estimate); corporate profits (2Q16, preliminary estimate), and University of Michigan’s consumer sentiment index (final August) come out.
The first estimate showed real GDP rose 1.2 percent in 2Q16, anemic but higher than 0.9 percent in 4Q15 and 0.8 percent in 1Q16. Post-Great Recession, growth has averaged a mere 2.1 percent, versus 3.2 percent going back to 2Q47.
Corporate profits adjusted for inventory and depreciation inched up 0.3 percent quarter-over-quarter in 1Q16 to $1.9 trillion (SAAR). Earnings peaked at $2.16 trillion in 3Q14.
The preliminary August estimate showed consumer sentiment inched up four-tenths of a point m/m to 90.4. The cycle high 98.1 was reached in January last year – an 11-year high.
Ms. Yellen speaks on Friday at 11 am.
Currently net long 54k, down 4.5k.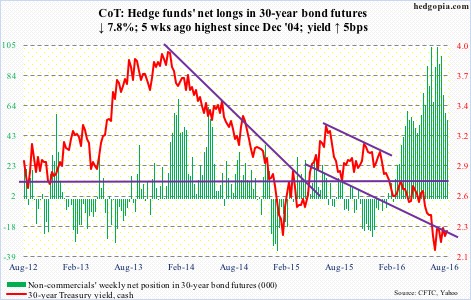
Crude oil: The EIA data for the week ended August 12th, released Wednesday, for the most part favored oil bulls. Spot West Texas Intermediate crude was already up 4.7 percent in the first two sessions. On Wednesday, buyers showed up near the 50-day moving average. By the time the week was over, it was up 10.4 percent.
The daily chart is now extended; on a weekly basis, there is room for more rally. It is a matter of which timeframe wins out.
The June 9th high of $51.67/barrel is 5.2 percent away.
The trend in gasoline continues to be good. Stocks dropped by 2.7 million barrels to 232.7 million barrels – down 26 million barrels from February 12th this year.
Crude stocks decreased 2.5 million barrels to 521.1 million barrels. Inventory is now down 22.3 million barrels from the April 29th high of 543.4 million barrels, which was the highest since the all-time high 545.2 million barrels in October 1929.
Crude imports fell, too, by 211,000 to 8.2 million barrels per day – a four-week low.
Refinery utilization rose 1.3 percentage points to 93.5 percent, which was the highest since the November 27th week last year.
Crude production, on the other hand, rose by 152,000 b/d to 8.6 mb/d. This was a seven-week high. Production peaked at 9.61 mb/d in the June 5th week last year.
Distillate stocks rose by 1.9 million barrels to 153.1 million barrels.
Currently net long 294k, up 27k.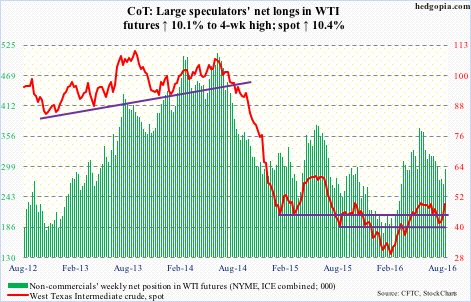
E-mini S&P 500: The churning action continues. The S&P 500 made yet another high – 2193.81 – but was flat for the week. In the past couple of weeks, it has gone nowhere.
For a change, $307 million moved into U.S.-based funds in the week ended Wednesday – first inflows in five weeks (courtesy of Lipper). Bulls sure hope this is the beginning of a trend change. These funds have been bleeding for a while.
Since the week to September 30th last year, $110 billion has been redeemed; $67 billion has come out since the February 10th week. As a reminder, after sizable drops, the S&P 500 bottomed on September 29th last year and then on February 11th this year.
Also in the week ended Wednesday, SPY, the SPDR S&P 500 ETF, attracted $453 million. This follows inflows of $1.6 billion last week. North of $6 billion has moved into the ETF since June 27th. Post-Brexit, the S&P 500 bottomed on that day.
But of late the index has continued to churn. The week produced a doji – second in two weeks.
Currently net long 154k, up 53.3k.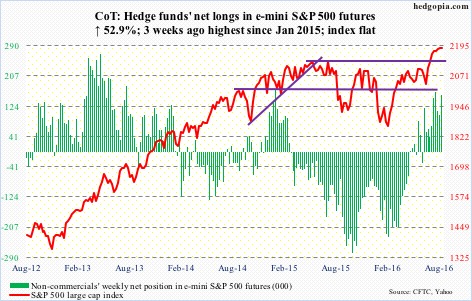
Euro: Eurozone CPI posted a gain of 0.2 percent y/y in July. Core CPI rose 0.9 percent y/y. They both matched estimates. The euro rallied 0.6 percent on Thursday, but probably not due to the inflation news.
The currency was able to build this week on last week’s successful defense of the 50-day moving average. The 200-day moving average continues to curl up, though ever so slightly.
On a weekly basis, there is still room it to rally, but daily conditions are now grossly overbought, with Thursday closing above the steeply rising daily upper Bollinger band and Friday producing a doji.
Currently net short 92.5k, down 5.9k.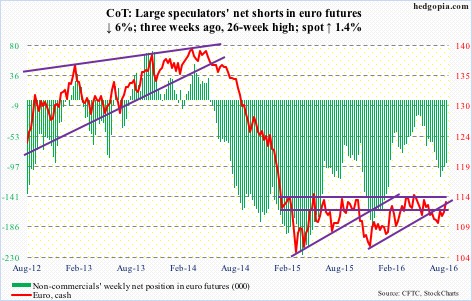
Gold: After two weeks of inflows totaling $816 million, GLD, the SPDR gold ETF, saw a drawdown of $646 million in the week ended Wednesday (courtesy of ETF.com).
Spot gold has gone sideways for essentially nine weeks now. The ETF has attracted $1.8 billion since June 24th. This money has not returned much, and potentially could get impatient.
Non-commercials continue to remain heavily net long as well.
The weekly MACD is on the verge of a bearish crossover. Gold bugs need to step up for this not to complete.
Currently net long 283.9k, down 2.6k.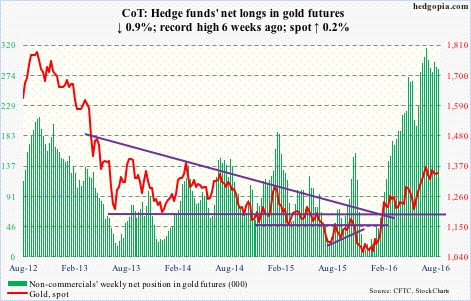
Nasdaq 100 index (mini): In the week ended Wednesday, QQQ, the PowerShares Nasdaq 100 ETF, attracted $744 million, coming on the heels of cumulative inflows of $2.1 billion in the prior three (courtesy of ETF.com).
In the week, the Nasdaq 100 surpassed the March 2000 all-time high of 4816.35 by 21 points before dropping back below. There is a lot of movement, without making much progress. The week produced a doji.
Currently net long 127.9k, down 3.7k.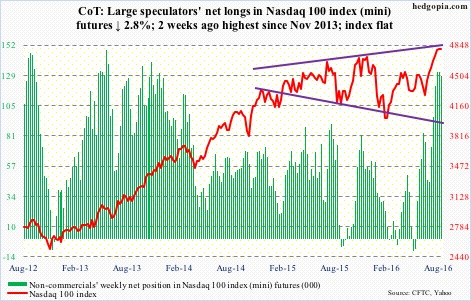
Russell 2000 mini-index: For the fourth week running, the Russell 2000 has remained above the breakout point of 1210-ish. That said, there are signs of fatigue.
The index is flat over the past couple of weeks, with a spinning top this week and a doji last week.
In the week ended Wednesday, $144 million into IWM, the iShares Russell 2000 ETF. Last week, $2 billion came in.
Currently net long 7.1k, up 4.6k.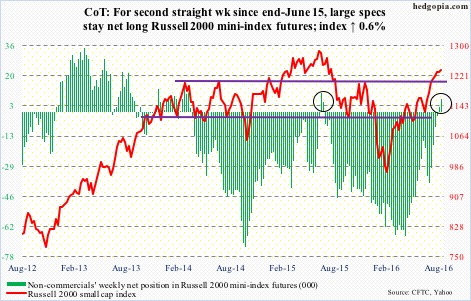
US Dollar Index: Wednesday’s July FOMC minutes showed a divided Fed, and probably leaned dovish. Ahead of the meeting, two-year yields – most sensitive to rate expectations – had risen to 0.76 by Tuesday. They have dropped to 0.71 percent.
The FOMC meeting took place on July 26-27, prior to the release of July’s payroll report, which showed the month produced a whopping 255,000 non-farm jobs, following June’s 292,000. This should have raised rate-hike expectations. This is not reflected in the dollar index, which fell 1.3 percent in the week.
Currently net long 16.5k, up 702.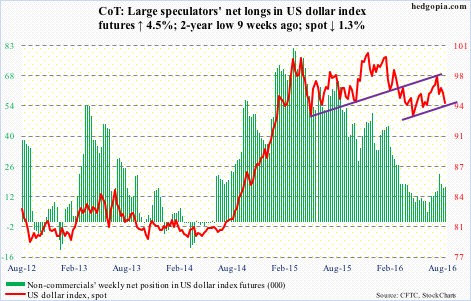
VIX: Spot rose to 13.71 intra-day On Wednesday but was unable to hang on to the gains, as the daily upper Bollinger band provided stiff resistance. That high also approximated the 13-week exponential moving average, which also resisted rally attempts two weeks ago. The average is downward-sloping.
The VIX-to-VXV ratio continues to linger in oversold territory – now for eight straight weeks, six of them in mid- to high-0.70s and the first two in low-0.80s. Most recently, between mid-March and end-May this year, the ratio remained oversold for 12 long weeks, before spiking higher in the next four. The longer it remains oversold, the higher the odds of a spike in due course. Like a coiled spring!
Last week, non-commercials’ net longs rose to the highest ever. This week, it dropped some, but remains massive. This can be a source of squeeze.
Currently net short 114.1k, down 4.7k.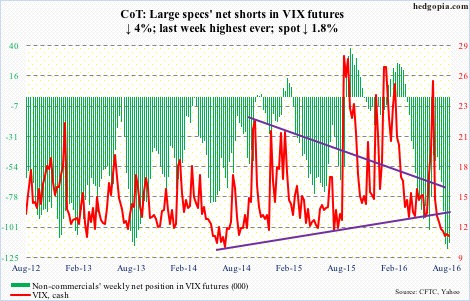
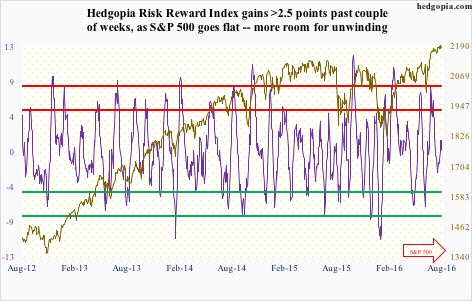
Hedgopia Risk Reward Index