The following are futures positions of non-commercials as of August 23, 2016. Change is week-over-week.
10-year note: In the Greenspan era, traders did not have to deal with the kind of mixed messages they do today. Back then, the message was uniform – for the most part, anyway.
Later, the Bernanke Fed started a more liberal culture. FOMC members began to express themselves more freely. The Yellen Fed has continued with this. Maybe to an excess.
The FOMC consists of 12 members – seven members of the board of governors, the president of the New York Fed, and four of the remaining 11 regional bank presidents. The seven non-voting members attend the meetings as well.
Not a week goes by when at least a member or two – voting or non-voting – do not have a speaking engagement scheduled. These messages obviously are not uniform, as they are speaking their minds. Plenty of room for traders to get whipsawed as a result.
Over the past week, at least three members delivered hawkish messages – Stanley Fischer, vice-chair, William Dudley, New York Fed president, and John Williams, San Francisco Fed president.
Come Friday, speaking at Jackson Hole, Chair Yellen seemed to side with the three above, but at the same time emphasized data dependency – the usual middle-of-the-road message. More confusion for the markets!
Currently net long 48.4k, up 21.8k.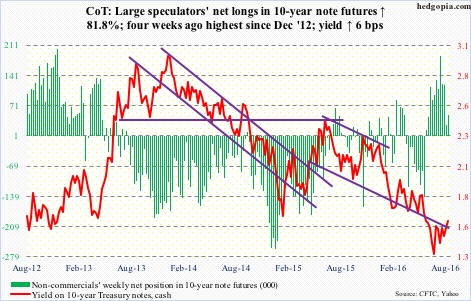
30-year bond: Major economic releases next week are as follows.
Monday brings personal income and spending for July. One data of interest is core PCE, which is the Fed’s favorite measure of consumer inflation. In June, it rose 1.57 percent year-over-year – higher versus 1.31 percent last July but lower from 1.66 percent this February.
The S&P/Case-Shiller U.S. home price index for June comes out on Tuesday. Nationally, May was up 5.1 percent y/y. Home prices have risen in four- to five-percent range in the last couple of years.
July’s pending home sales index is reported on Wednesday. June inched up two-tenths of a point to 111. April was 115 – the highest since March 2006.
On Thursday, productivity (2Q16, revised) and ISM manufacturing index (August) are published.
The preliminary estimate showed output per hour declined at a 0.5 percent annual rate in 2Q16. This followed decreases of 2.4 percent in 4Q15 and 0.6 percent in 1Q16. Productivity has been an absolute disappointment in the current recovery.
Manufacturing PMI fell six-tenths of a point in July to 52.6. Orders fell to 56.9 from 57 month-over-month.
On Friday, employment (August) and durable goods (July, revised) come out.
July was a big surprise in job creation. Non-farm payroll jumped 255,000 m/m, coming on the heels of 292,000 in June. That said, the monthly average in the first seven months this year is 186,000, slower than 229,000 in 2015 and 251,000 in 2014.
The advance report on durable goods for July was reported last week. Orders for non-defense capital goods ex-aircraft – proxy for business capital expenditures – rose 1.6 percent m/m. Orders fell 3.5 percent y/y – ninth consecutive drop.
Four Fed officials are scheduled to speak during weekdays.
Currently net long 57.7k, up 3.8k.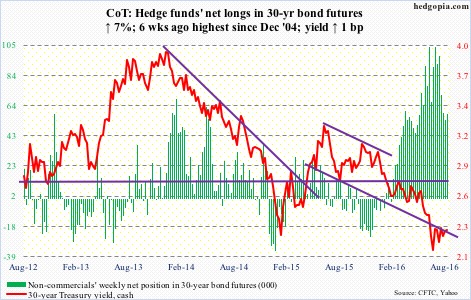
Crude oil: Easy come, easy go? Too soon to reach that conclusion, but a lot is riding on OPEC’s informal meeting slated for late September. Mere talk of possible announcement of production freeze has done wonders to crude oil, with spot West Texas Intermediate crude rallying 26 percent in a little over two weeks before coming under pressure this week. Oil bulls need results not just rumors for these gains to sustain.
Especially considering that at last Friday’s intra-day high spot WTI was a hair’s breadth away from the neckline of a potentially bullish reverse head-and-shoulders formation. Longs decided to lock in gains.
The EIA data for the week ended August 19th provided a good excuse.
Stocks rose. Crude inventory rose by 2.5 million barrels to 523.6 million barrels, gasoline inventory by 36,000 barrels to 232.7 million barrels, and distillate inventory by 122,000 barrels to 153.3 million barrels.
Crude imports increased 449,000 barrels per day to 8.6 million b/d.
Refinery utilization dropped one percentage point to 92.5 percent.
Crude production, however, fell slightly, by 49,000 b/d to 8.5 mb/d. Production peaked at 9.61 mb/d in the June 5th week last year.
Immediately ahead, it will be interesting to see if WTI longs can defend the 50-day moving average, which is two points lower.
Currently net long 365.4k, up 71.4k.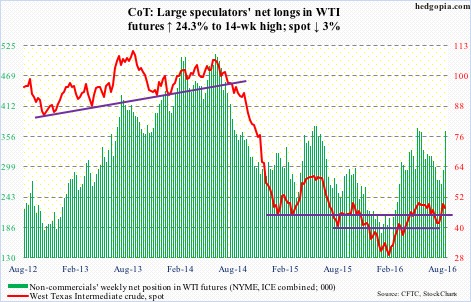
E-mini S&P 500: For the first time in eight weeks, in the latest week AAII bulls were lower than bears – 29.4 percent versus 29.6 percent. Investors Intelligence (56.7 percent bullish – 7th straight week of north of 50) and NAAIM (97.8 – 7th straight week in 90s, with one at 101.02) readings still heavily lean bullish.
Based on AAII survey, retail seems to be pulling in their horns a tad. This is also seen elsewhere. SPY, the SPDR S&P 500 ETF, saw outflows of $2.9 billion in the week ended Wednesday. This follows inflows of $2 billion in the prior two weeks (courtesy of ETF.com).
Similarly, in the week ended Wednesday last week, $307 million moved into U.S.-based equity funds – first inflows in five weeks (courtesy of Lipper). This week, the prevailing trend of outflows continued. $6.4 billion was withdrawn.
After more than a month of sideways action, the index this week lost both its 10- and 20-day moving averages. This follows two back-to-back weekly dojis and a couple of hanging man candles before that. There is plenty of room for the index to continue lower – particularly on the weekly chart. Of note here is the fact that buybacks seem to be slowing down.
Currently net long 192.4k, up 38.4k.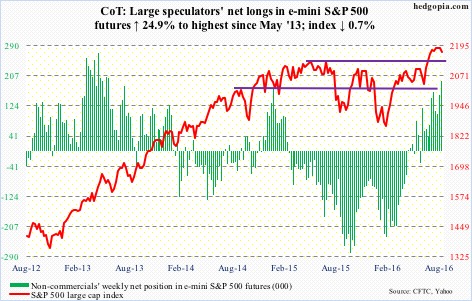
Euro: Eurozone IHS Markit PMI hit 53.3 this month, up slightly from 53.2 in July, so far implying no post-Brexit jitters. This probably also implies that the ECB would not feel the need for additional stimulus when it meets next month.
For the week, the euro marched to the beat of its own drum – technical drum.
On Thursday last week, the currency rose to $113.69, just about testing resistance at $114, which goes back to early January. This week, it lost 1.2 percent. Has room to go down more. The 50-day moving average is 0.4 percent away.
Currently net short 76.7k, down 15.9k.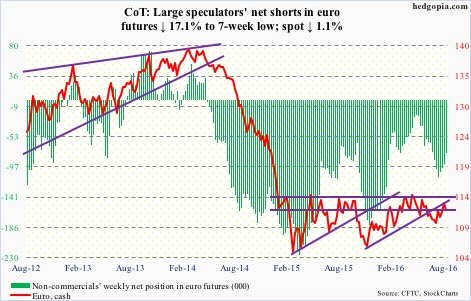
Gold: After a drawdown of $646 million in the week ended Wednesday last week, GLD, the SPDR gold ETF, saw inflows of $26 million this week (courtesy of ETF.com), but that was not enough.
Spot gold was already in overbought territory. Plus, several FOMC members leaned hawkish. The metal shed 1.5 percent in the week.
Daily conditions are oversold, but gold has room to go lower on a weekly basis. Of interest is if gold bugs can defend resistance-turned-support at $1,300.
Currently net long 294.6k, up 10.8k.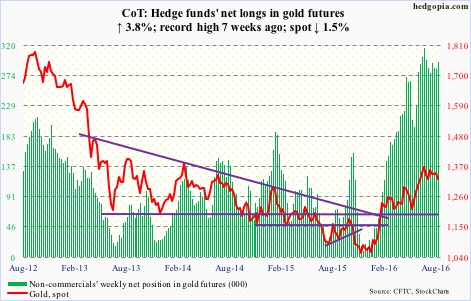
Nasdaq 100 index (mini): After four consecutive weeks of inflows totaling $2.8 billion, QQQ, the PowerShares Nasdaq 100 ETF, in the week ended Wednesday lost $434 million (courtesy of ETF.com).
Shorter-term moving averages are rolling over. The 0.5-percent drop this week followed last week’s doji. Breakout retest lies around 4700, followed by 4560.
Currently net long 128.1k, up 183.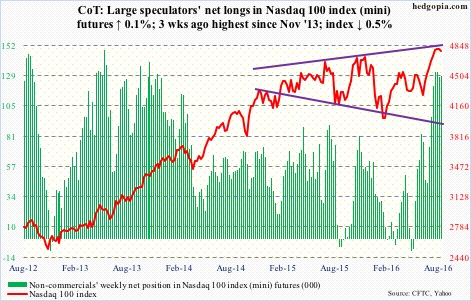
Russell 2000 mini-index: This was the third consecutive week the Russell 2000 remained essentially flat. Retail can grow impatient. There were some signs of this as in the week ended Wednesday $1.1 billion was withdrawn from IWM, the iShares Russell 2000 ETF. This came on the heels of inflows of $2.2 billion in the prior two.
This week’s action followed a weekly spinning top last week and a doji before that. Weekly momentum indicators are itching to go lower.
Currently net long 16k, up 8.9k.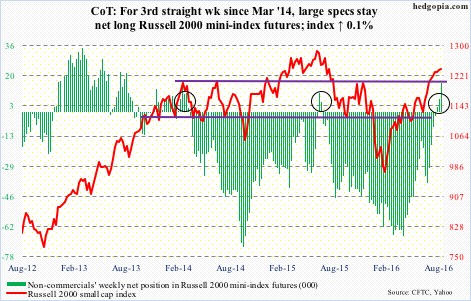
US Dollar Index: Dollar bulls fought tooth and nail to save the rising trend line from May this year. So far, they have succeeded. The dollar index bounced off that support twice, including Friday when it jumped 0.8 percent.
It will be interesting to see if post-Yellen speech non-commercials changed their hitherto tentative attitude toward the dollar index. We will find out next week.
Currently net long 16k, down 503.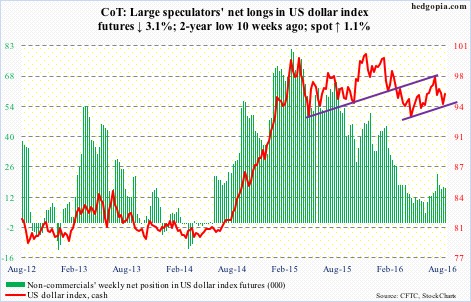
VIX: Spot rallied to 14.09 on Thursday before pulling back, ending the session up 1.3 percent to 13.63; the session high came within spitting distance of the still-dropping 50-day moving average at 14.20. Once again on Friday, it rallied to 14.93 intra-day only to close at 13.65.
Inability to hang on to the gains is a negative. That said, the upper Bollinger band is now rising. As well, the 10-day moving average has crossed over the 20-day – the first time since mid-June this has happened.
In the right circumstances, there is room for weekly oversold conditions to continue to unwind. As is VIX:VXV.
The VIX-to-VXV ratio rose to .84 after languishing in oversold territory for eight long weeks, the last six of which were in mid- to high-.70s.
Currently net short 121.5k, up 7.4k.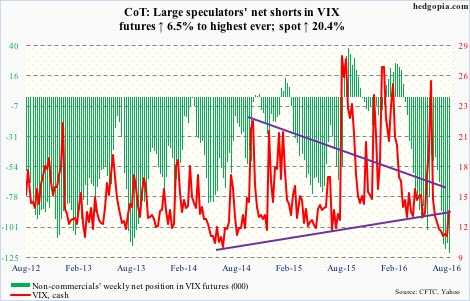
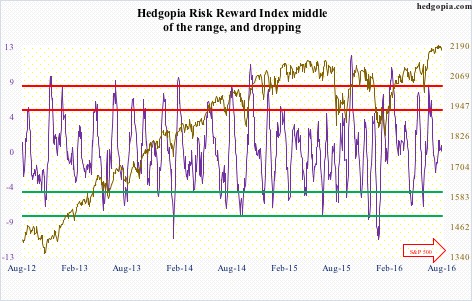
Hedgopia Risk Reward Index