The following are futures positions of non-commercials as of September 6, 2016.
10-year note: Is the ECB reaching the end of the stimulus rope? This is not a consensus thinking, but the bank may very well be trying to send that signal.
The Thursday meeting did not live up to markets’ expectations. Leading up to it, Eurozone’s IHS Markit PMI fell to 52.9 in August from 53.2 m/m, and Germany’s industrial production in July fell 1.5 percent m/m to the lowest since August 2014, igniting hopes that the bank would at least extend the current €80-billion/month asset purchases beyond next March. Did not happen. Interest rates were left unchanged.
The ECB, and other major central banks such as the Fed and the Bank of Japan, have tried to stimulate their economies/ignite inflation since the onset of the financial crisis. From zero-bound rates to quantitative easing to negative interest rates to purchases of corporate bonds, you name it, the ECB has tried everything. The result has been sub-par.
Ditto with the BoJ. This month, it meets on September 20-21 – same as the FOMC – and is under pressure to add to stimulus. Odds are it will end up disappointing as well. Central bankers are increasingly trying to shift focus to the fiscal side of things, but even there, developed nations are sitting with extended balance sheets.
Currently net long 104.8k, up 3.3k.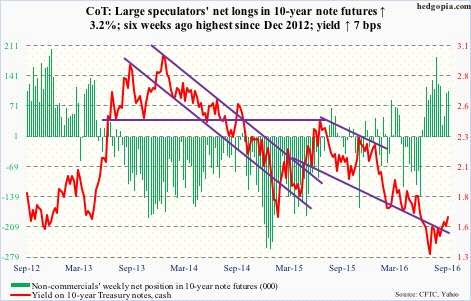
30-year bond: Major economic releases next week are as follows.
Tuesday brings August’s NFIB small business optimism index. July inched up one-tenth of a point month-over-month to 94.6. The cycle high was reached in December 2014 at 100.3 – the highest since October 2006.
On Thursday, PPI-FD (August), retail sales (August), and industrial production (August) come out.
Producer prices for final demand dropped 0.4 percent in July. In the 12 months through July, the producer price index fell 0.2 percent. Core PPI was unchanged in July, and was up 0.8 percent in the 12 months through July.
Retail sales inched down 0.04 percent m/m in July to a seasonally adjusted annual rate of $457.7 billion. This was the first monthly drop in four months. Sales grew 2.3 percent year-over-year in July.
U.S. capacity utilization rose 0.7 percent m/m in July to 75.9 percent. Annually, utilization has dropped for 17 consecutive months. The cycle peaked in November 2014 at 78.9 percent, which was the highest since July 2008.
On Friday, CPI (August), University of Michigan’s consumer sentiment (September, preliminary), and Treasury International Capital (July) are published.
Consumer prices were unchanged in July m/m, and rose 0.8 percent in the 12 months through July. Core CPI inched up 0.1 percent m/m in July; annually, it increased 2.2 percent – the ninth straight y/y rise in core CPI.
Consumer sentiment inched down to 89.8 in August from July’s 90. The cycle peaked at 98.1 in January 2015 – an 11-year high.
Foreign investors continue to avoid both U.S. stocks and Treasury securities. In June, on a 12-month running total basis, foreigners sold $241.7 billion in Treasury notes and bonds, and $118.7 billion in equities.
Currently net long 24.1k, down 4.3k.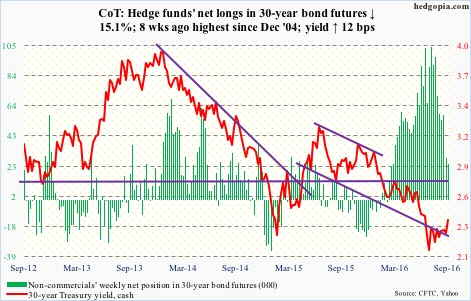
Crude oil: Support at $43-$43.50 on spot West Texas Intermediate crude was defended last week. It feebly built on that this week.
News quoting a National Iranian Oil Co. official that Iran can raise daily production to four million barrels in two to three months from the current 3.8 million barrels was passed over. Traders in particular focused on the EIA data.
In the week ended September 2nd, crude stocks fell 14.5 million barrels to 511.4 million barrels. This was the lowest since February 19th this year.
Gasoline stocks dropped by 4.2 million barrels to 227.8 million barrels – the lowest since December 25th last year.
Crude production declined by 30,000 barrels per day to 8.46 million b/d. Production peaked at 9.61 mb/d in the June 5th week last year.
Crude imports fell by 1.8 mb/d to 7.07 mb/d – the lowest since November 13th last year.
Refinery utilization rose nine-tenths of a point to 93.7 percent – the highest since November 27th last year.
The only negative data point was distillate inventory, which rose by 3.4 million barrels to 158.1 million barrels.
Spot WTI rallied 3.2 percent for the week. The EIA data was probably influenced by Hermine, so oil in all likelihood may find it difficult to maintain recent momentum.
Currently net long 298.3k, down 61k.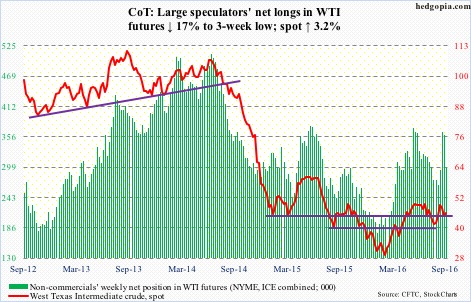
E-mini S&P 500: After seven weeks of sideways move, the S&P 500 finally cracked. Turns out the consolidation post-July breakout was not part of a continuation pattern.
From the February lows through recent highs, the S&P 500 rallied 21 percent, so fatigue was normal. Conditions were grossly overbought, and flows were tentative.
In the week ended Wednesday, $271 million left U.S.-based equity funds (courtesy of Lipper). Since the week ended February 10th this year, $75 billion has been redeemed.
In the same week, SPY, the SPDR S&P 500 ETF, attracted another $2.4 billion. This follows inflows of $2.9 billion in the prior week (courtesy of ETF.com). North of $7 billion has moved into the ETF in the past eight weeks. With Friday’s 2.5-percent sell-off, this money probably grows restless.
Especially so if the S&P 500 is unable to hold support. On Friday, it sliced through the 50-day moving average as well as 2135, but is literally sitting on support going back to February last year.
Currently net long 183.6k, down 16.4k.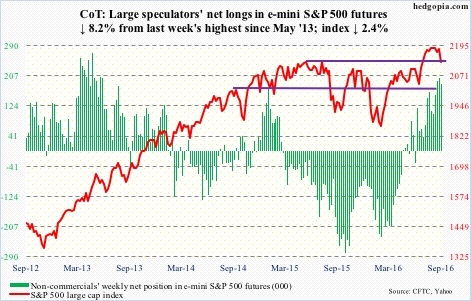
Euro: As explained earlier, the ECB announced nothing new on Thursday. The euro rallied in that session, but was unable to hang on to the gains – closed up 0.2 percent, was up 0.8 percent intra-day.
Near term, the currency could go either way.
Currently net short 92.6k, up 10.7k.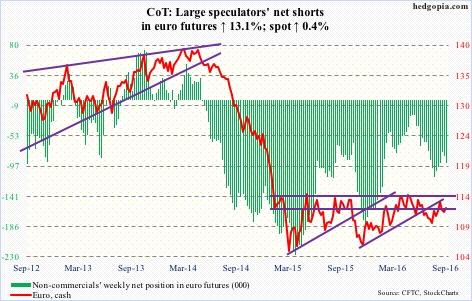
Gold: Last week, gold bugs defended support at $1,300/ounce. This week, spot gold began with a 2.1-percent jump on Tuesday, but could not keep up the momentum. The ECB decision did not help. Ditto with increasing rate-hike rhetoric in the U.S.
In the week ended Wednesday, GLD, the SPDR gold ETF, attracted $382 million, following outflows of $642 million in the prior week (courtesy of ETF.com). Gold bugs should hope this continues, as the metal is probably itching to once again go test the afore-mentioned support.
Currently net long 307.9k, up 31.5k.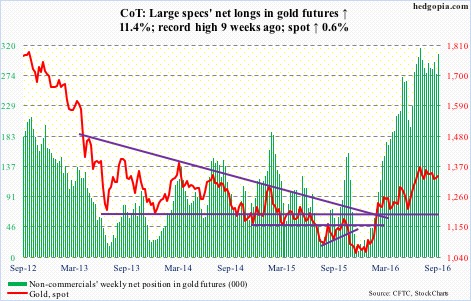
Nasdaq 100 index (mini): The Nasdaq 100 index scored a new intra-day all-time high, rising to 4839.59 on Wednesday. Facebook (FB) and Amazon (AMZN) made fresh all-time highs. Alphabet (GOOGL) came very close to surpassing August’s all-time high. These three joined Apple (AAPL) and Microsoft (MSFT) in the world’s top-five list of companies by market value – all tech. Contrarians would probably begin to worry by this statistic.
The Nasdaq 100, sideways since August 5th, suffered a weekly bearish engulfing candle, and lost support at 4700. Next decent support is 2.5 percent away.
In the week ended Wednesday, QQQ, the PowerShares Nasdaq 100 ETF, lost $298 million, following outflows of $1.1 billion in the prior week (courtesy of ETF.com).
Currently net long 143.7k, down 3.3k.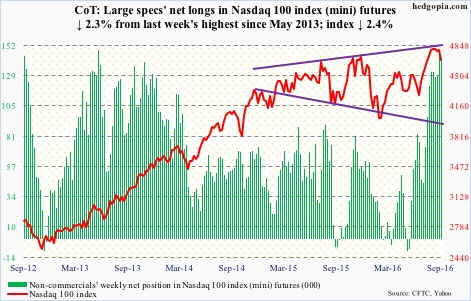
Russell 2000 mini-index: Even as the S&P 500 essentially went sideways for nearly two months, the Russell 2000 small-cap index continued to grind higher. The weekly high this Wednesday was merely 2.8 percent from the June 2015 all-time high of 1296. Friday changed all that, with the index down 3.1 percent. The weekly chart has plenty of room to continue lower.
Flows were not cooperating to begin with. IWM, the iShares Russell 2000 ETF, lost $546 million in the week ended Wednesday, following drawdown of $1.4 billion in the prior two (courtesy of ETF.com).
Currently net long 23.3k, up 1.2k.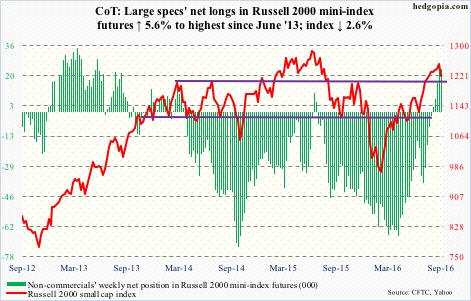
US Dollar Index: Once again, spot US dollar index tested the lower bound of a May 2016 rising channel. For several sessions in the second half of August, that support was tested and defended; the resulting rally was then rejected at the 200-day moving average.
The recent uptick in rate-hike talk is yet to convince non-commercials to begin to aggressively add to net longs.
Currently net long 17k, down 2k.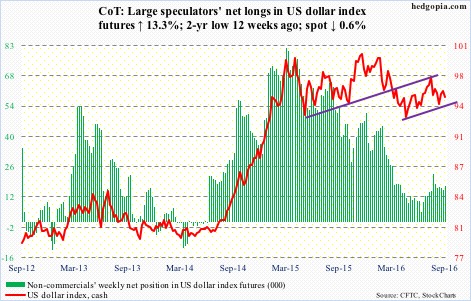
VIX: Risk happens fast. That was the lesson on Friday.
After languishing in oversold territory for nearly 10 weeks, the VIX-to-VXV ratio surged from .765 last week to .929. Spot VIX surged 40 percent on Friday, past both 50- and 200-day moving averages.
Going into this, non-commercials were holding the highest-ever net shorts in VIX futures. We would not know until next week the extent of short squeeze that probably took place on Friday.
As well, in the options market, there was massive divergence between the 21-day moving average of the CBOE equity put-to-call ratio and the ISEE index (all equity). As things stand, the former looks to be a signal, and the latter noise.
Currently net short 133.7k, up 6k.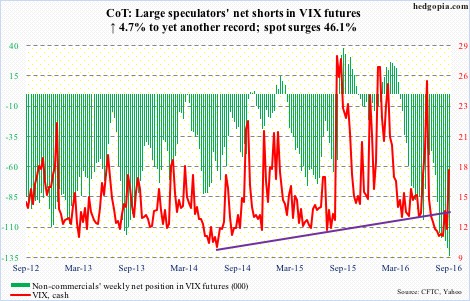
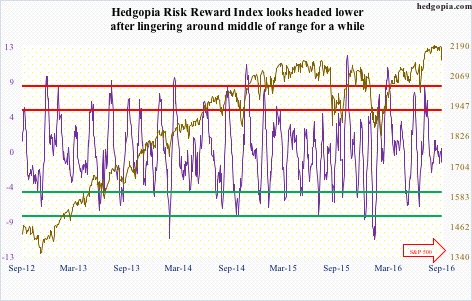
Hedgopia Risk Reward Index