The following are futures positions of non-commercials as of September 20, 2016.
10-year note: A steeper yield curve is typically associated with a strengthening economy. So when the Bank of Japan says it will target a steeper yield curve, what does it imply? That the bank has finally hit on a panacea or that it is fast reaching the end of the stimulus rope.
It will be a while before we know for sure. But the bank’s latest maneuver is a verdict on the last one – that the negative interest rate policy was a failure. Big time.
Now it is the yield curve Haruhiko Kuroda, BoJ governor, and his team have their sights set on. The goal is noble. Banks borrow short and lend long. In theory, a steeper curve goes a long way. It will help these institutions, who supposedly would then want to go out and make loans. There is one problem with this theory.
As much as banks would like to make loans in a steeper yield environment, not much thought has been given to the other party – the borrower.
Post-Great Recession, one of the constants has been a persistent lack of end-demand. Rates are at/near/below zero. If that has not stimulated demand, it is hard to imagine a steeper yield curve would.
Currently net long 116.9k, up 48.3k.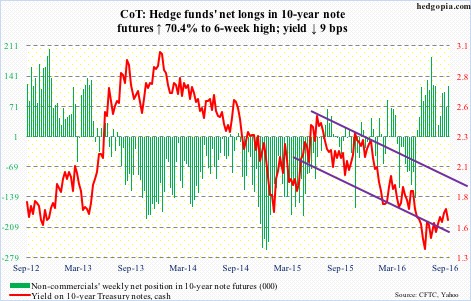
30-year bond: Major economic releases next week are as follows.
August’s new home sales come out on Monday. July jumped 12.4 percent month-over-month to a seasonally adjusted annual rate of 654,000 units – the highest since 727,000 in October 20007.
Tuesday brings the S&P Case-Shiller housing price index for July. June was up 5.1 percent year-over-year. The national index has persistently risen at a four to five percent range the last couple of years.
The advance report on durable goods for August is due out on Wednesday. July orders for non-defense capital goods ex-aircraft – proxy for business capex – were up 1.5 percent m/m to $63.4 billion (SAAR) and down 4.9 percent y/y. This was the 9th consecutive y/y decline. Orders peaked at $70.4 billion in September 2014.
On Thursday, we get GDP (2Q16, third, and final, estimate), corporate profits (2Q16, revised estimate), and pending home sales (August).
The second estimate showed real GDP grew 1.1 percent in 2Q16, on the heels of growth of 0.8 percent in 1Q16 and 0.9 percent in 4Q15.
Corporate profits with inventory valuation and capital consumption adjustments fell 1.2 percent quarter-over-quarter to $2 trillion (SAAR). This was the 5th q/q contraction in profits in the last six quarters. Profits peaked at $2.22 trillion in 4Q14.
Pending home sales rose 1.3 percent m/m in July to 111.3. April’s 115 was the highest since 115.4 in March 2006.
Personal income and outlays (August) and the University of Michigan’s consumer sentiment (September, final) come out on Friday.
In July, core PCE – the Fed’s favorite measure of consumer inflation – rose 1.57 percent y/y, higher than 1.31 percent a year ago but the last time this metric rose north of two percent was in April 2012.
Preliminarily, September consumer sentiment was unchanged m/m at 89.8. The cycle peaked at 98.1 in January 2015, which was an 11-year high.
Eight FOMC members are scheduled to speak during weekdays.
Currently net short 1.6k, down 9.4k.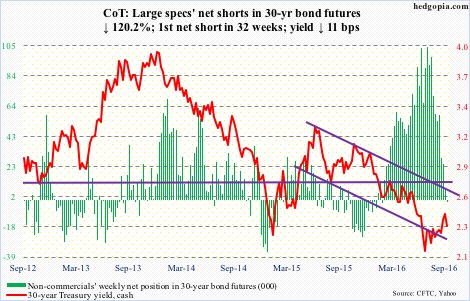
Crude oil: Saudi Arabia produced a record 10.673 million barrels per day in July, up from 10.550 mb/d in June. Its crude exports rose to 7.622 mb/d from 7.456 mb/d in June. Next week, OPEC meets in Algiers. Its 14 members are pumping more than 33 million barrels per day. Inaction means oil glut only gets worse.
In the U.S., in the week ended September 16th, crude stocks fell by 6.2 million barrels to 504.6 million barrels – the lowest since February 26th this year.
Gasoline stocks dropped by 3.2 million barrels to 225.2 million barrels. This was the lowest since December 25th last year.
Distillate stocks, however, rose by 2.2 million barrels to 165 million barrels – the highest since January 8th this year.
Crude production increased by 19,000 b/d to 8.51 mb/d – a four-week high. Production peaked at 9.61 mb/d in the June 5th week last year.
Crude imports stood at 8.3 mb/d, up 247,000 b/d.
Refinery utilization fell nine-tenths of a point to 92 percent – a 13-week low.
Spot West Texas Intermediate crude on Tuesday once again tested support at $43-$43.50, which held. This was followed by recapturing of the 50-day moving average, which was again lost on Friday. The spot would have met the declining trend line drawn from the June 9th high of $51.67/barrel around $48, but retreated before reaching there, with the intra-day high on Friday of $46.55. The pattern of lower highs since that peak continues.
Currently net long 280.2k, down 37.3k.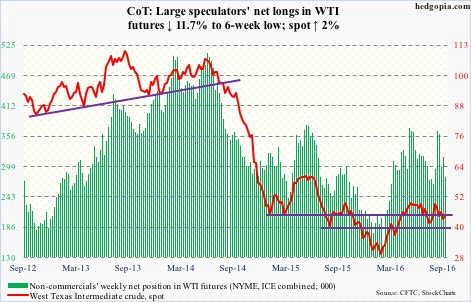
E-mini S&P 500: Companies will start reporting 3Q16 in a couple of weeks. As has been the case for at least the last six quarters, estimates have been under persistent pressure going into earnings. Since the quarter started, 3Q16 operating earnings estimates have been cut by $0.97 to $29.36 … and by $5.25 since the end of 1Q15. If past is guide, this helps stocks. In five of the last six quarters, the S&P 500 was up in the first month of the quarter, when earnings are reported.
Bulls would appreciate a little help from flows, though. In the week ended Wednesday, SPY, the SPDR S&P 500 ETF, lost another $3.1 billion; last week, $3.4 billion was withdrawn (courtesy of ETF.com).
In the same week, U.S.-based equity funds lost $3.4 billion (courtesy of Lipper). Since the June 29th week this year, $40 billion has been redeemed, and $93 billion since the February 10th week this year. The S&P 500 had important bottoms around those dates.
The index rallied strongly off of make-or-break support at 2120, but were repelled at 2178 resistance. Bulls have the ball, and it is theirs to lose.
Currently net long 95.5k, up 1.9k.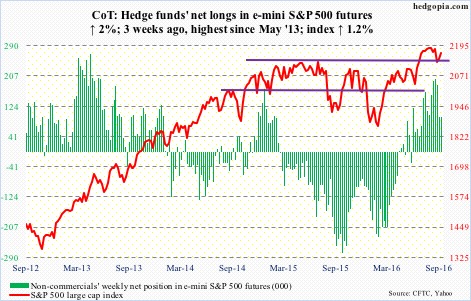
Euro: Spot euro tested the 200-day moving average mid-week, before rallying off of it on Wednesday, and recapturing the 50-day in the process.
The currency has been held down by a declining five-week trend line.
Currently net short 85k, up 3.6k.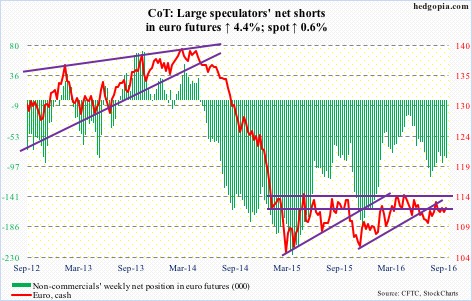
Gold: The $1,300/ounce level continued to provide support on spot gold. At the same time, it has been making lower highs since July 6th. A trend line drawn from that high would have been tested around $1,350, which also approximates the daily upper Bollinger band. On Thursday, the metal rose to $1,347.8, before retreating slightly.
The metal is holding its own amidst increasing signs that central banks are nearing the end of the aggressive stimulus rope.
In the week ended Wednesday, GLD, the SPDR gold ETF, attracted $374 million (courtesy of ETF.com).
Currently net long 256.2k, down 29.2k.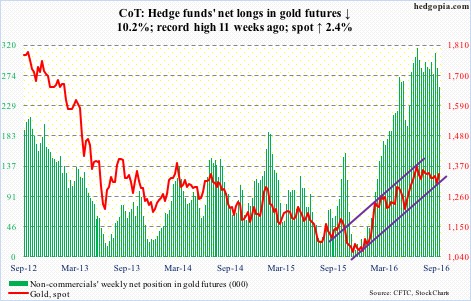
Nasdaq 100 index (mini): The Nasdaq 100 had a mini breakout, rising to a new high. Last week, Apple (AAPL), with more than 10 percent of the weight, was a big help. Not so this week. If anything, having rallied big off of iPhone announcement, it is likely to be a drag near term … it needs to hold $110.
Amazon (AMZN) and Alphabet (GOOGL), on the other hand, rallied to fresh all-time highs.
The Nasdaq 100’s daily chart is extended, with a weekly spinning top this week.
In the week ended Wednesday, QQQ, the PowerShares Nasdaq 100 ETF, saw $1.5 billion in inflows, pretty much reversing last week’s $1.7 billion in outflows (courtesy of ETF.com).
Currently net long 118.7k, up 22.5k.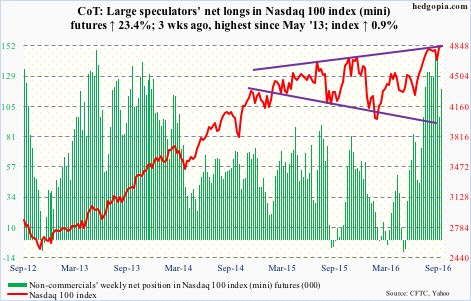
Russell 2000 mini-index: The Russell 2000 was able to build on last week’s successful breakout retest; this support goes back to March 2014. The Thursday intra-day high was a mere 2.6 percent from the all-time high of 1296 reached in June last year.
In the week ended Wednesday, IWM, the iShares Russell 2000 ETF, lost $358 million, but that was mainly due to Monday’s redemption of $877 million (courtesy of ETF.com). That said, flows need to improve. Plus, non-commercials cut back net longs in the last couple of weeks.
Currently net long 7.8k, down 448.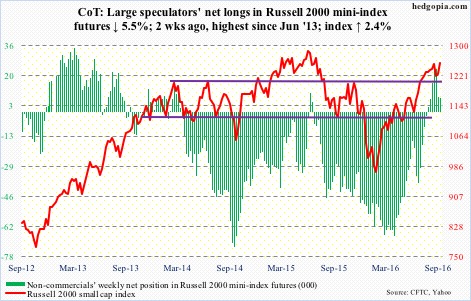
US Dollar Index: The spot had a wild ride on Wednesday, first rallying post-BoJ and then weakening post-FOMC, with the session high kissing the upper Bollinger Band and also past the 200-day moving average; in the end, it lost both 50- and 200-day.
The probable path of least resistance is down, with a test of the early-May 2016 rising trend line around 94.50, which is where the lower Bollinger band lies.
Currently net long 14.4k, down 2.7k.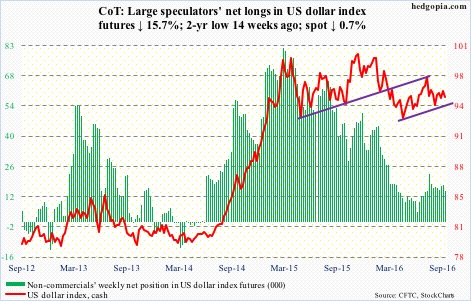
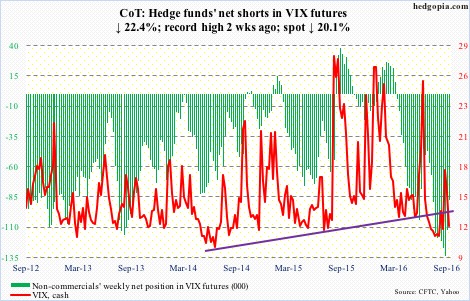
VIX: Spot VIX did a round trip in 11 sessions – from sub-12 on the 8th to 20-plus on the 12th to back below 12 by Thursday, concurrently losing the 50-day moving average.
The daily overbought conditions are all but unwound. At best, the cash goes sideways here, as it is at the low end of years-long range.
The VIX-to-VXV ratio dropped to .766. Intra-day on the 12th, it did spike to 1.07; prior to this, the ratio languished in oversold territory – .70s and .80s – for 10 weeks. Equity bulls must be hoping for similar sideways action.
Currently net short 87.6k, down 25.3k.