The following are futures positions of non-commercials as of September 27, 2016.
10-year note: Once again, Mario Draghi, ECB chief, urged Eurozone governments to complement central-bank action. He was speaking before the European parliament on Monday. Mr. Draghi said there are dangers to keeping interest rates too low for too long.
This is one more time a central banker is hinting they may have reached the end of the stimulus rope.
At the Jackson Hole meeting in late August, several of them stressed the need for backup from fiscal policy.
This Wednesday, Patrick Harker, president of the Philadelphia Fed, said monetary policy has reached the limits of what it can do and it is time for fiscal and other policy to step up. He is a voting FOMC member.
It is interesting how, after years of ultra-loose monetary policy and massive expansion of the balance sheet – which has failed to produce the desired results insofar as inflation and economic growth are concerned – these bankers would like to pass the baton to the fiscal side of things.
Currently net long 140.4k, up 23.5k.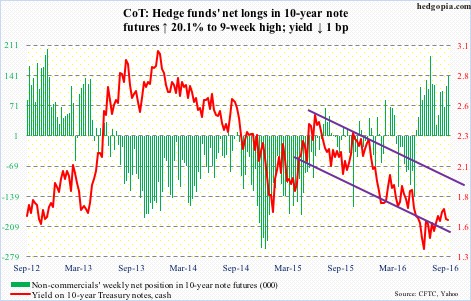
30-year bond: Major economic releases next week are as follows.
September’s ISM manufacturing index is published on Monday. August dropped 3.2 points month-over-month to 49.6 – first sub-50 reading in six months. Orders collapsed 7.8 points m/m to 49.1 – the lowest since 48.8 last December.
Wednesday brings ISM non-manufacturing index (September) and durable goods (August, revised).
Non-manufacturing PMI fell 4.1 points m/m in August to 51.4. This was the lowest since 50.8 in February 2010. Orders collapsed 8.9 points m/m to 51.4 – the lowest since 50.9 in December 2013.
August orders for non-defense capital goods ex-aircraft – proxy for business capex – rose 0.6 percent m/m to a seasonally adjusted annual rate of $63.3 billion. This was the third successive monthly increase. Orders fell 3.1 percent year-over-year – 10th straight y/y decline and 19th out of last 20 months.
September’s employment report comes out on Friday. Non-farm payroll softened in August to 151,000 from 275,000 in July and 271,000 in June. The 2016 monthly average is 182,000, slower than 229,000 in 2015 and 251,000 in 2014.
Six FOMC members are scheduled to speak during weekdays.
Currently net short 13.7k, up 12.2k.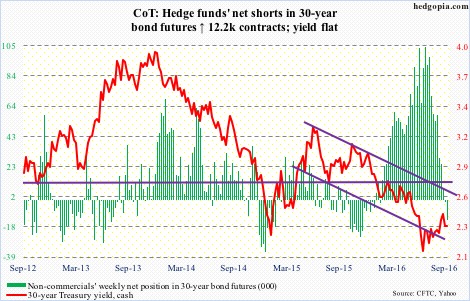
Crude oil: OPEC commits itself to cutting output to between 32.5 million barrels per day and 33 mb/d. In August, the cartel produced 33.24 mb/d. The last time the 14-member group, with a little over one-third market share globally, cut production was during the financial crisis in 2008. Shows how much the producers, including Saudi Arabia, are hurting.
In the grand scheme of things, fundamentally this is not that big of a cut, given the prevailing oil glut. Also on Wednesday, but before the OPEC decision, the International Energy Agency said it did not see the oil market rebalancing until late 2017.
That said, OPEC’s decision speaks of the producing nations’ intent – that they are willing to compromise. Saudi Arabia in particular, which produced a record 10.673 million barrels per day in July, is capitulating. There are no details yet on how the cuts will be implemented – a potential source of discord later. Iran in particular seems to be targeting pre-sanction market share not just four mb/d.
When it is all said and done, this may prove to be a life line for U.S. shale oil, which then means glut persists, precisely what OPEC is trying to avoid. Time will tell.
Be that as it may, it was enough of a catalyst for traders to push up spot West Texas Intermediate crude 5.3 percent on Wednesday – past the August 19th declining trend line – and then another 2.5 percent in the next two sessions. The 50-day moving average has been recaptured.
A bigger hurdle lies around $48/barrel, which approximates the declining trend line drawn from the May 2015 high of $62.58. The spot ended the week right on that resistance.
On a related note, mid-September short interest on XLE, the SPDR energy ETF, surged 38 percent period-over-period. These shorts probably got squeezed, leading to the 5.7-percent surge on Wednesday through Friday. The ETF closed the week at $70.61 – right at resistance, which goes back to March 2011.
Trader sentiment on Wednesday was also helped by the EIA data.
In the week ended September 23, U.S. crude stocks fell by 1.9 million barrels to 502.7 million barrels – the lowest since February 5 this year.
Distillate stocks dropped by the same amount to 163.1 million barrels. The prior week was the highest since January 8 this year.
Gasoline stocks, however, rose by two million barrels to 227.2 million barrels. The prior week was the lowest since December 25 last year.
Crude imports fell by 474,000 b/d to 7.8 mb/d.
Crude production declined 15,000 b/d to 8.5 mb/d. Production peaked at 9.61 mb/d in the June 5th week last year.
Refinery utilization stood at 90.1 percent, down from 92 percent. This was a 17-week low.
Currently net long 309.4k, up 29.3k.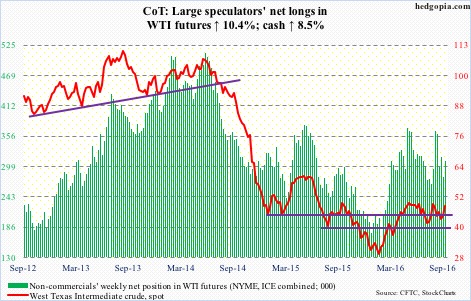
E-mini S&P 500: The S&P 500 index struggled one more time at 2175-2180 … rose to 2175.3 intra-day Friday, before closing at 2168.27, literally closing at the 50-day moving average. The average is now flattish to down – potentially important development.
In the week ended Wednesday, SPY, the SPDR S&P 500 ETF, attracted $1.7 billion, coming on the heels of outflows of $6.4 billion in the prior two (courtesy of ETF.com).
In the same week, for a change, U.S.-based equity funds attracted $622 million – the first positive week in six weeks (courtesy of Lipper). In the August 17th week, $307 million came in, but in the next five, north of $25 billion was withdrawn. Therein lies the problem. Outflows are dominant.
Currently net long 60.1k, down 35.3k.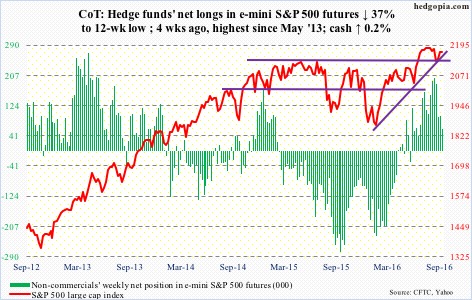
Euro: Through Thursday’s intra-day low of $11.19, Deutsche Bank stock was more than cut in half this year. Spot euro is up 3.5 percent for the year. The latter is not least bit worried. (DB traded sub-$10 pre-open on Friday, before reversing.)
A rising trend line drawn from early December last year was defended on Friday last week. As well, another rising trend line drawn from July 22 drew buyers this week; the 200-day moving average was defended on Friday.
On the other hand, since May 3 this year, the spot has been held down by a declining trend line. A break, either way, will be important. There is indecision. The first four daily candles this week, as well as last Friday, speak of this.
Currently net short 76k, down 9k.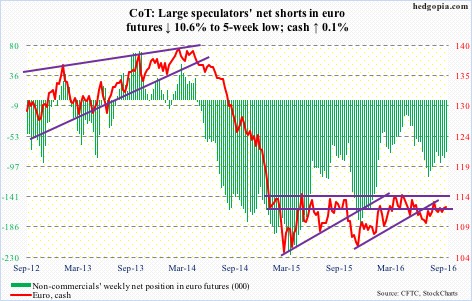
Gold: Yet another lower high since the July 6th high of $1,357.5/ounce. The spot was also not able to save the 50-day moving average which it had captured last week. Should the metal continue to come under pressure, the $1,300 level has provided solid support since late June this year.
In the week ended Wednesday, GLD, the SPDR gold ETF, lost $77 million, after inflows of $374 million in the prior week (courtesy of ETF.com).
Currently net long 291.9k, down 35.7k.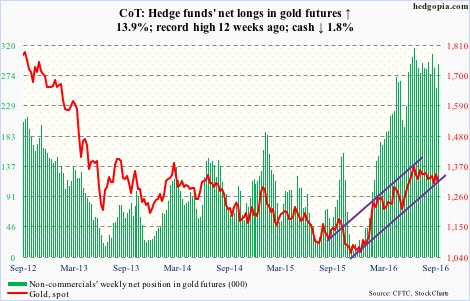
Nasdaq 100 index (mini): The Nasdaq 100 is having to work hard to save the mini break out of 4840 seven sessions ago.
Of the top five tech names, Amazon (AMZN), up 3.9 percent for the week to yet another record, was the only one rising more than the Nasdaq 100’s 0.35-percent rise. The e-retailer has gone parabolic. A breather is due, at least near term.
In the week ended Wednesday, QQQ, the PowerShares Nasdaq 100 ETF, saw $456 million in inflows, following inflows of $1.5 billion in the prior week (courtesy of ETF.com).
Currently net long 136.5k, up 17.8k.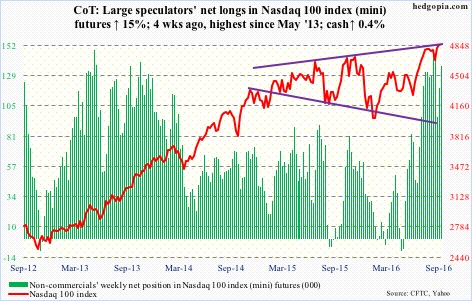
Russell 2000 mini-index: The all-time high of 1296 reached in June last year continues to be elusive. At last week’s high, the Russell 2000 was only 2.6 percent away. Of major U.S. indices, this is the only one yet to score a new high, which probably remains that way at least for a while.
The weekly chart produced a hanging man candle. Momentum is waning.
In the week ended Wednesday, IWM, the iShares Russell 2000 ETF, gained $927 million, owing primarily to $1.6 billion in inflows last Friday (courtesy of ETF.com).
Currently net long 11.5k, up 3.7k.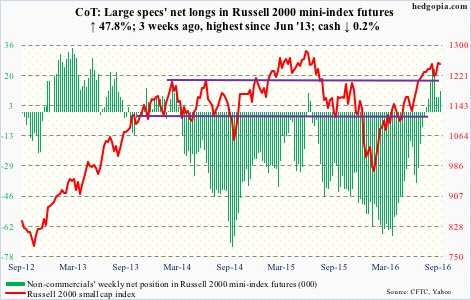
US Dollar Index: On Wednesday through Friday, the spot was rejected at the 50-day moving average, which is now slightly declining. The week produced a doji.
Going forward, the early-May 2016 rising trend line is worth watching. Dollar bulls have continued to defend that support, and it will be tested around 95.
Currently net long 12.2k, down 2.2k.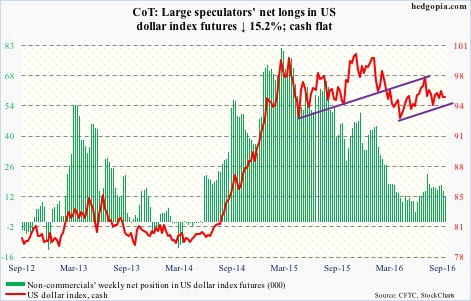
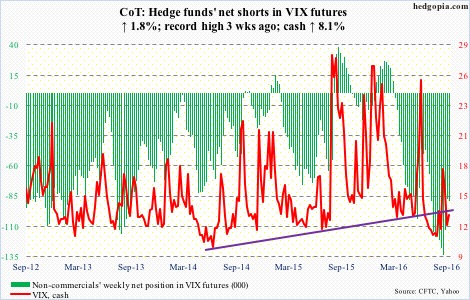
VIX: The spot continues to be volatile, with a range of 12.14 and 15.69 on Thursday, and 12.53 and 15.20 on Friday. That said, the 50-day moving average is now beginning to rise, although ever so slightly – potential reason for volatility bulls to get emboldened should this persist.
Since August 5 this year, spot VIX has been making higher highs, confirmed by daily MACD.
Currently net short 89.1k, up 1.5k.