The following are futures positions of non-commercials as of October 4, 2016.
10-year note: Bloomberg ran a story on Tuesday saying the ECB would probably gradually wind down bond purchases before the end of quantitative easing, and that it may do so in steps of €10 billion/month. Currently, the bank buys €80 billion/month. The program runs through March of next year, or beyond, if necessary.
If it is not just a trial balloon and the ECB is serious about it, the tapering would probably look similar to the Fed’s. In December 2013, the latter began tapering its bond purchases by $10 billion/month from the original $85 billion. By October 2014, it was done.
As relates to the ECB, in the September meeting, markets had high expectations that the current QE would be extended beyond March 2017 but the bank did not oblige. If a taper does indeed occur, would the ECB be doing it because of realization that its policies have failed to meaningfully impact the economy or due to some other reason? The ECB is indeed running out of bonds to buy. Ditto with the Bank of Japan.
In this respect, we have a Fed chief who recently commented that U.S. monetary policy is “moderately accommodative!” The fed funds rate has remained near zero for eight years. The truth is, we are in crisis accommodation. Hence it should not come as a surprise if central bankers are angling for some other form of accommodation.
Fiscal stimulus is one option. Indeed, in recent weeks/months, several central bankers have urged their respective governments for fiscal help.
But then, most developed countries run a leveraged balance sheet. In the U.S., with federal debt of $19.4 trillion, the debt-to-GDP ratio was 1.05 in 2Q16 – 15th straight quarter of debt exceeding nominal GDP. In a divided Congress, fiscal-stimulus bills are unlikely to get a smooth passage. Unless the Fed finds a way to finance these expenditures.
Currently net long 127.2k, down 13.2k.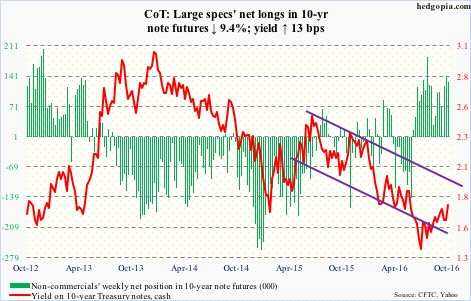
30-year bond: Major economic releases next week are as follows.
The NFIB small business optimism index for September is published on Monday. August dropped two-tenths of a point month-over-month to 94.4. The cycle peaked in December 2014 at 100.3, which was the highest since 100.7 in October 2006.
Wednesday brings JOTLS (August) and FOMC minutes (September 20-21 meeting).
July job openings rose by 228,000 m/m to a seasonally adjusted 5.87 million. April this year was 5.85 million, and July last year 5.79 million – essentially sideways for a year.
Retail sales (September), PPI-FD (September), and the University of Michigan’s consumer sentiment index (October, preliminary) are due out on Friday.
August retail sales inched down 0.3 percent m/m to a seasonally adjusted annual rate of $456.3 billion. Sales grew 1.9 percent year-over-year – first sub-two-percent growth in five months.
Producer prices were flat in August both m/m and in the 12 months through August. Core PPI increased 0.3 percent, and 1.2 percent in the 12 months through August.
Consumer sentiment rose 1.4 points m/m in September to 91.2. Cycle high was reached in January last year at 98.1 – an 11-year high.
Four FOMC members are scheduled to speak during weekdays, including Janet Yellen, Fed chair, who speaks at 12:30 PM on Friday.
Currently net long 10.3k, up 24.1k.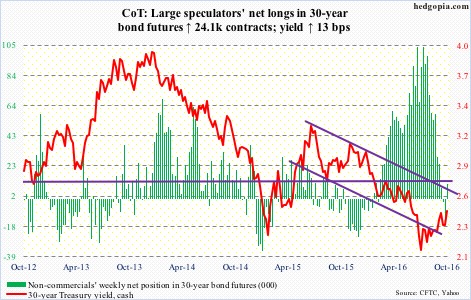
Crude oil: Spot West Texas Intermediate crude managed to break out of the declining trend line drawn from May last year. The June 9th high of $51.67/barrel has now taken on greater significance. Until that high gets taken out, crude remains range bound, with the August 3rd low of $39.19 on the bottom end.
This week, the EIA data helped trader sentiment as well.
In the week ended September 30, U.S. crude stocks fell by three million barrels to 499.7 million barrels – the lowest since January 22 this year.
Distillate stocks dropped, too, by 2.4 million barrels to 160.7 million barrels.
Crude imports fell by 125,000 barrels per day to 7.7 million b/d.
Ditto with crude production, which declined by 30,000 b/d to 8.47 mb/d. Production peaked at 9.61 mb/d in the June 5th week last year.
Refinery utilization, however, fell from 90.1 to 88.3 percent – a 23-week low.
And gasoline stocks rose by 222,000 barrels to 227.4 million barrels.
Spot WTI remains overbought on the daily chart. It has been trading along a rising trend line from February lows, so the recent breakout could prove to be important, should it manage to take out the June 9th high. On the other hand, price likely retreats near term. The February trend line gets tested around $45.
Currently net long 343.9k, up 34.5k.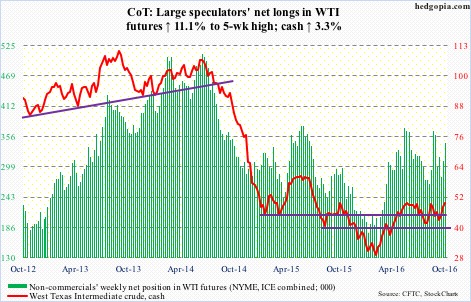
E-mini S&P 500: NYSE margin debt declined $3.3 billion m/m to $471.2 billion in August; the S&P 500 index fell 0.12 percent in the month. After peaking at $507.2 billion in April last year, margin debt bottomed at $435.8 billion in February, which is when stocks in general troughed. Historically, the two tend to correlate well with each other. But since that April peak, margin debt is down $35.9 billion, even as the S&P 500 broke out to a new high.
There is a similar divergence in play between the S&P 500 and flows into U.S.-based equity funds. Since the week ended February 10 this year, the latter has lost nearly $102 billion. In the week ended Wednesday, another $9.1 billion was redeemed (courtesy of Lipper). In the same week, SPY, the SPDR S&P 500 ETF, attracted $155 million, after inflows of $1.7 billion in the prior week (courtesy of ETF.com).
The 50-day moving average on the cash continues to drop – albeit ever so slightly – and resisted rally attempts all week. For now, the index remains range-bound – between 2175 and 2120.
Currently net long 45.1k, down 15k.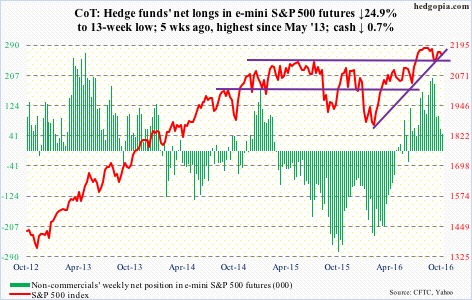
Euro: Markit PMI for Eurozone dropped to a 20-month low of 52.6 points in September, down three-tenths of a point m/m.
The euro dropped below its 200-day moving average intra-day Tuesday, but managed to close higher. This was repeated on Friday, with a big engulfing white candle.
The rising trend line from July 22 this year is intact. As is one drawn from December last year. Rally attempts have been held down by a declining trend line from May 3 this year. In other words, a break – either way – probably awaits the currency. Daily Bollinger bands are tightening.
Currently net short 82.1k, up 6k.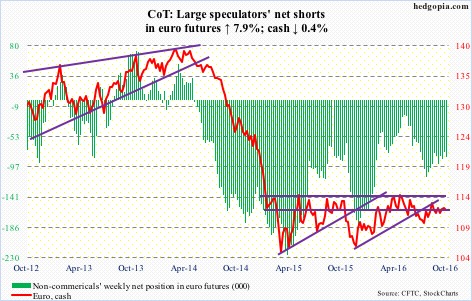
Gold: After making lower highs since reaching $1,377.5 on July 6 and testing support at $1,300 on three different occasions since that high, spot gold finally broke down on Tuesday, collapsing 3.3 percent.
There is solid support at $1,180, which goes back to November 2009. But the spot is seven percent away from that level – unlikely it gets tested anytime soon.
On Friday, the metal tested the 200-day moving average and closed below; GLD, the SPDR gold ETF, on the other hand, dropped all the way to $118.42 before reversing and closing up $0.08 to $119.74, above that average. The path of least resistance is up.
In the week ended Wednesday, GLD lost $50 million – not much given the sell-off on Tuesday (courtesy of ETF.com).
Predictably, non-commercials cut net longs by 15.9% – to the lowest since the record high 13 weeks ago. Medium-term risk is if these traders continue to reduce their holdings.
Currently net long 245.5k, down 46.4k.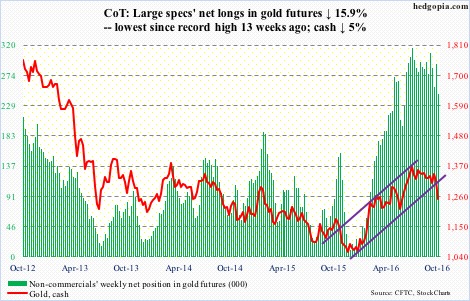
Nasdaq 100 index (mini): In the week ended Wednesday, QQQ, the PowerShares Nasdaq 100 ETF, saw $823 million in outflows, following inflows of $1.9 billion in the prior couple of weeks (courtesy of ETF.com).
The September 21st mini-break out of 4840 was defended several times this week, but increasingly there are signs bulls are struggling to save it. The weekly chart flashed a doji.
Currently net long 137.4k, up 897.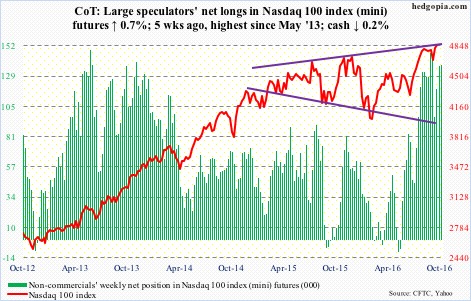
Russell 2000 mini-index: The 50-day moving average on the cash was tested three times this week, with the index closing the week right on it. The average is still rising but seems to be in the process of going flat, and then down in due course.
Since the June 27th low through last month’s high, the Russell 2000 rallied north of 16 percent. Since June 27 through this Wednesday, IWM, the iShares Russell 2000 ETF, attracted only $88 million, versus SPY’s $5.1 billion and QQQ’s $664 million. In the week ended Wednesday, IWM saw outflows of $555 million (courtesy of ETF.com).
Currently net long 16.5k, up 5.1k.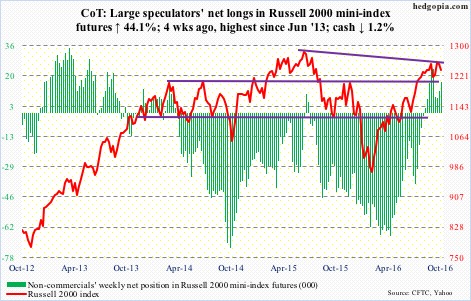
US Dollar Index: Monday’s ISM report (manufacturing up 2.1 points m/m to 51.5 in September), gave a jolt to the US dollar index. Plus, Jeffrey Lacker, the Richmond Fed president, and Loretta Mester, president of the Cleveland Fed, made hawkish comments.
Spot US dollar index rallied past its 200-day moving average, and is also past its 50-day. Both these averages are declining. It rallied 1.3 percent for the week, but was unable to take out the declining trend line from December 3 last year. Daily momentum indicators are overbought.
Currently net long 12.1k, down 105.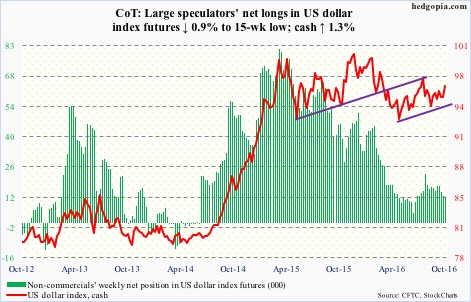
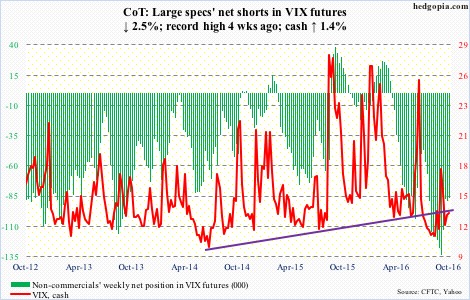
VIX: The 50-day moving average on the cash continues to inch higher, but at the same time VIX is struggling to close above that. On Friday, it achieved that feat with a long-legged doji. Since August 5 this year, the cash has been making higher highs, and the streak continued this week.
Volatility is suppressed.
For the past three weeks, the VIX-to-VXV ratio has remained suppressed in high-0.70s/low-0.80s.
Currently net short 86.9k, down 2.2k.