The following are futures positions of non-commercials as of October 11, 2016.
10-year note: In late September, Janet Yellen, Fed chair, said the bank might be able to help the U.S. economy in a downturn if it could buy stocks and corporate bonds. Here are a few problems with this:
One, as things stand, the Fed cannot do this unless Congress allows it.
Two, and more important, the very discussion of the Fed buying stocks is troubling. We are all aware of the so-called Fed put, and floating of this idea is yet another example of the bank attempting to create a floor underneath stocks. On a trailing 12-month basis, the S&P 500 large cap index already trades at 21x operating earnings. Value guys have been patiently waiting – a while – for a decent sell-off, which should have been a normal occurrence in a normal market.
Three, how is this even going to help the economy? The BoJ and the SNB already purchase stocks/ETFs, and it has been anything but a stellar success. The BoJ and the ECB also purchase corporate bonds. The story is the same.
The Fed has the benefit of being witness to this. Did not someone say, wise men learn from mistakes of others?
Currently net long 43.8k, down 83.3k.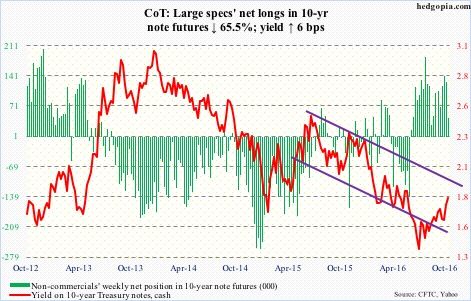
30-year bond: Major economic releases next week are as follows.
September’s industrial production comes out on Monday. August was the 12th consecutive month of year-over-year contraction. Capacity utilization, at 75.5 percent and having peaked at 78.9 percent in November 2014, has dropped y/y for 18 straight months.
Tuesday brings consumer price index (September), NAHB housing market index (October), and Treasury International Capital (August).
Builder sentiment jumped six points month-over-month to 65 in September, tying a 10-year high reached in October last year.
Consumer prices rose 0.2 percent m/m in August and 1.1 percent y/y. Core CPI increased 0.3 percent m/m and 2.3 percent y/y. This was the 10th straight y/y increase of north of two percent.
July was the first month in six – and second in 12 – foreigners purchased U.S. equities, buying $26.5 billion worth. On a rolling 12-month total basis, at -$99.1 billion, they were still selling, but much less than a record -$138.9 billion in February this year.
Housing starts for September is published on Wednesday. Starts fell 5.8 percent m/m in August to a seasonally adjusted annual rate of 1.21 million units – level also reached in June last year and February this year.
Existing home sales for September are reported on Thursday. August fell 0.9 percent m/m to 5.33 million units (SAAR). The cycle high of 5.57 million units was reached in June – highest since 5.79 million in February 2007.
Three FOMC members are scheduled to speak during weekdays.
Currently net short 985, down 11.3k.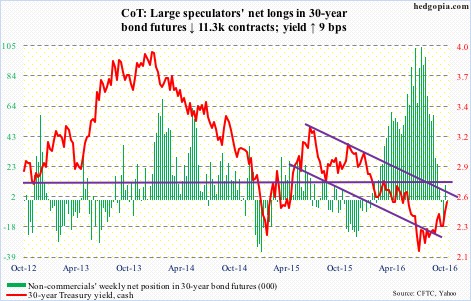
Crude oil: On Tuesday, Russia and Saudi Arabia, two leading producers, said they are ready to cooperate to limit output. At the end of September, Russia produced 11.1 million barrels per day, and Saudi Arabia 10.6 mb/d. Later that day, the CEO of state-controlled Rosneft said he was not ready to cap his production. Yet another mixed signal, even as oil has priced in a successful OPEC meeting later next month.
Technically, spot West Texas Intermediate crude slightly built on last week’s break out of the declining trend line drawn from May last year. Then it stalled at the June 9th high of $51.67/barrel, rising to $51.60 on Monday. Until that high gets taken out, crude remains range bound, with the August 3rd low of $39.19 on the bottom end. The path of least resistance near term is down.
In the week ended October 7, the EIA data was mixed.
Crude stocks increased 4.9 million barrels to 474 million barrels. But both gasoline and distillates inventory declined – by 1.9 million barrels to 225.5 million barrels and by 3.7 million barrels to 157 million barrels, respectively.
Crude production declined by 17,000 b/d to 8.45 mb/d – a nine-week low. But imports rose by 151,000 b/d to 7.86 mb/d.
Refinery utilization fell 2.8 percentage points to 85.5 percent, matching the low in mid-January last year.
Currently net long 381.3k, up 37.4k.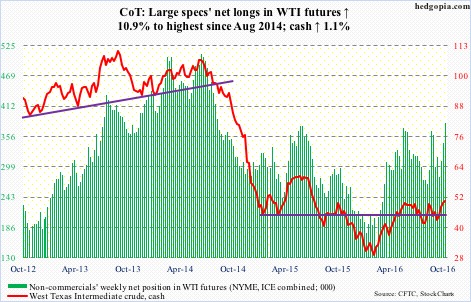
E-mini S&P 500: The week offered a little something for both bulls and bears.
Tuesday’s 1.2-percent drop sliced through the rising trend line from February 11 this year. Then on Thursday, early weakness was bought at the 150-day moving average, with the cash violating support at 2120 intra-day but closing the session above. That support needs to give way before shorts can claim an edge.
Judging by the 16.6-percent drop (to 223.8 million) in short interest on SPY, the SPDR S&P 500 ETF, in the September 15-30 period, shorts probably do not anticipate a breakdown soon. That said, considering that the short interest was at a 20-month low, there are lesser odds of a squeeze-fueled rally. For reference, in the middle of January this year, SPY short interest stood at 318.2 million.
The ETF lost $1.8 billion in the week ended Wednesday, reversing the inflows of the prior two weeks (courtesy of ETF.com). In the same week, another $3.4 billion came out of U.S.-based equity funds (courtesy of Lipper).
Currently net short 33.8k, down 79k.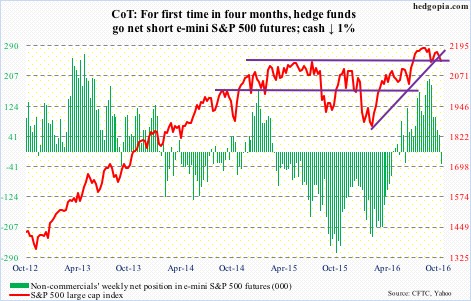
Euro: Eurozone production in August was 1.6 percent higher m/m and up 1.8 percent y/y. The increase was led by Germany, the Eurozone’s largest exporter to the U.K. Data like this helps ease concerns about the pound’s potential impact on exports; the currency has dropped sharply post-Brexit vote.
Nonetheless, any adverse economic impact from Brexit would take time to unfold. Last Saturday, Mario Draghi, ECB president, said exactly that, saying Britain’s vote to leave was significant. More ECB stimulus then in the future? Regardless, the euro lost the 200-day moving average as well as the rising trend line from November last year.
Currently net short 93.5k, up 11.4k.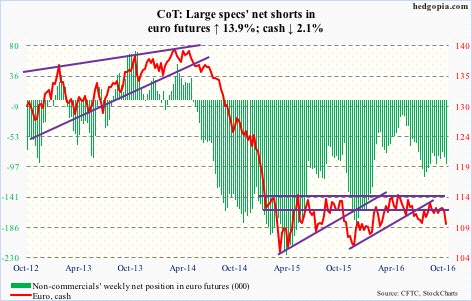
Gold: On Friday last week, gold bugs put their foot down while defending $1,240 support on spot gold. That low has not been violated. The metal spent the week trading around the 200-day moving average. Ditto with GLD, the SPDR gold ETF. There is a tug of war going on between bulls and bears around that average. In the past seven sessions, GLD had four dojis and a gravestone doji on Friday. Daily technicals are oversold. The path of least resistance is up – at least near term.
In the week ended Wednesday, GLD gained $455 million, following redemption of $127 million in the past couple of weeks (courtesy of ETF.com).
Currently net long 195.2k, down 50.3k.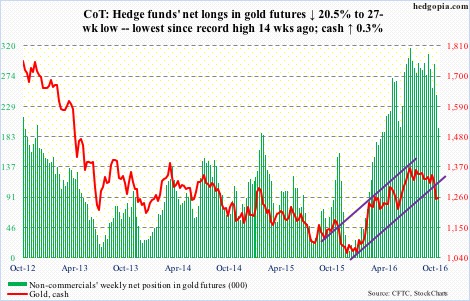
Nasdaq 100 index (mini): The Nasdaq 100 index reached a new record high of 4904.72 on Monday, only to then lose two-month support at 4840. The broken support-turned-resistance already stopped a rally attempt on Wednesday and then on Friday.
The weekly MACD is on the verge of a bearish MACD crossover, and other momentum indicators have turned down.
In the meantime, QQQ, the PowerShares Nasdaq 100 ETF, continued to bleed, with outflows of $103 million in the week ended Wednesday, following outflows of $823 million in the prior week (courtesy of ETF.com).
Interestingly, in the September 15-30 period, short interest on QQQ dropped 21 percent to 47.7 million – the lowest since mid-November last year – even as the ETF rallied 1.2 percent. This reduces the odds of a squeeze-fueled rally. At the end of February, short interest peaked at 73.1 million. QQQ/Nasdaq 100 bottomed in early February.
Currently net long 129.3k, down 8.1k.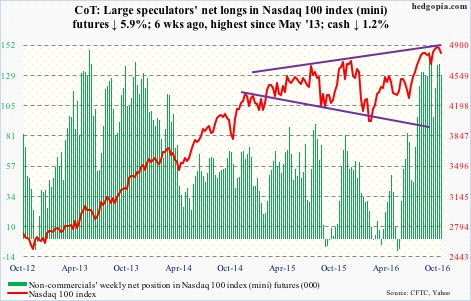
Russell 2000 mini-index: The 1200-plus support on the Russell 2000 was tested this week, and held. That said, it suffered a weekly bearish MACD crossover.
IWM, the iShares Russell 2000 ETF, continued to experience outflows this week. In the week ended Wednesday, $163 million left, on the heels of redemptions of $555 in the prior week (courtesy of ETF.com).
The 50-day moving average, now flattish, was lost on Tuesday, and is likely to provide resistance, should the Russell 2000 manage to stabilize here. The average is 2.1 percent away.
Currently net long 12.9k, down 3.6k.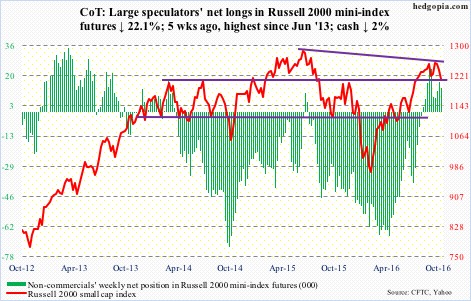
US Dollar Index: Last week, spot US dollar index rallied past its 200-day moving average to literally close on a declining trend line from December 3 last year. The momentum continued this week, and the index broke out of that trend line, as well as past July 2016 high for a ‘higher lows, higher highs’ pattern.
That said, in a larger scheme of things, it continues to trade within $100-plus and $93-plus. A breakout is sure to give the Fed an ulcer – or an excuse not to move come December.
Non-commercials jumped on the rally bandwagon this week. On a daily chart, the dollar index is way overbought.
Currently net long 33.5k, up 21.4k.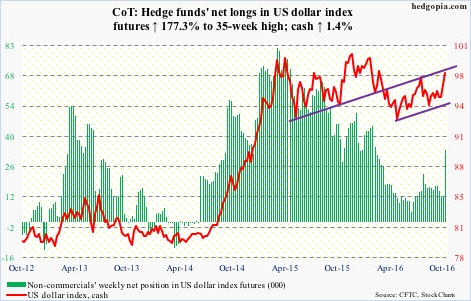
VIX: Volatility bulls must be liking what they are seeing. The 50-day moving average is beginning to rise. This week, it rallied past the 200-day, and there is room for continued momentum on a weekly chart. The daily chart, however, is beginning to look extended, with the cash producing a long-legged doji on Thursday, and on Friday the 200-day was lost.
Since August 5 this year, cash VIX (16.12) has been making higher lows, and, as things stand, it will be tested around 12.50. In the meantime, after remaining suppressed in high-0.70s/low-0.80s for three weeks, the VIX-to-VXV ratio, using Thursday’s intra-day highs, rose to 0.97 – just about unwinding the oversold condition it was in.
Currently net short 88k, down 1.1k.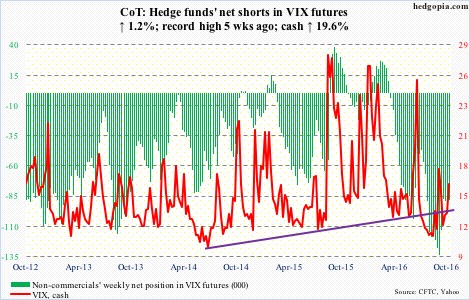
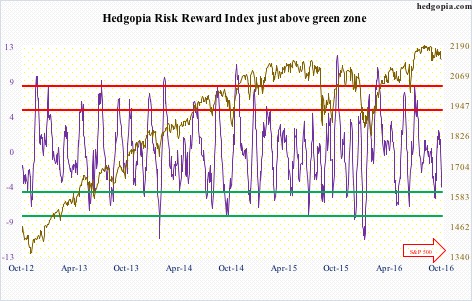
Hedgopia Risk Reward Index