The following are futures positions of non-commercials as of October 18, 2016.
10-year note: Both China and Japan reduced their holdings of Treasury notes and bonds in August – the former by a whopping $33.7 billion and the latter by $10.6 billion. These two nations are the largest holders of Treasury securities, and have been cutting back for a while.
China currently holds $1.19 trillion and Japan $1.14 trillion. At the peak, they respectively held $1.32 trillion (November 2013) and $1.24 trillion (November 2014) – meaning China since has sold nearly $132 billion worth and Japan nearly $98 billion worth.
At one time, Japan used to be the largest holder of Treasury securities, China was way behind. September 2008 was the first time the two tied at $618 billion. By July 2011, China was holding as much as $430 billion more than Japan did. Now it is aggressively cutting back. Why?
The Treasury has been issuing fewer notes and bonds.
Plus, the bond market has been in a mega bull market, so it is tempting to lock in profit.
And last but not the least, as relates to China, is yuan dynamics. The currency has been weakening, resulting in capital outflows. The PBoC needs funds to intervene so it does not get out of control.
This is where it could get problematic. Both U.S. presidential candidates plan on fiscal stimulus, which potentially means larger budget deficit as well as Treasury issuance. A scenario of continued yuan weakness/capital outflows/drop in China Treasury holdings potentially complicates things.
Currently net long 99.9k, up 56.1k.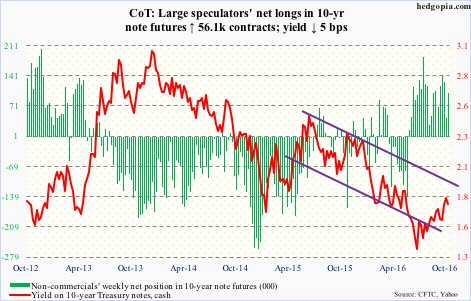
30-year bond: Major economic releases next week are as follows.
The S&P Corelogic Case-Shiller housing price index for August is reported on Tuesday. Nationally, prices rose 5.1 percent year-over-year in July.
New home sales for September come out on Wednesday. August was down 6.7 percent month-over-month to a seasonally adjusted annual rate of 609,000 units. July’s 659,000 was the highest since October 2007.
Thursday brings durable goods orders (September, advance); and pending home sales (September).
Orders for non-defense capital goods ex-aircraft rose 0.9 percent m/m to a seasonally adjusted annual rate of $63.5 billion, and dropped 2.6 percent y/y. This was the 12th straight y/y decline. Orders peaked at $70.7 billion in September 2014.
The pending home sales index declined 2.4 percent in August to 108.5. April’s (2016) 115 was the highest since March 2006.
Gross domestic product (3Q16, first estimate), employment cost index (3Q16), and the University of Michigan’s consumer sentiment (October, final) are published on Friday.
Real GDP grew 1.4 percent in 2Q16, following 0.8 percent in 1Q16 and 0.9 percent in 4Q15 – very subdued. The Atlanta Fed’s GDPNow model is forecasting two percent growth.
Compensation costs for private industry workers rose 2.4 percent annually in 2Q16. This was the highest growth rate in five quarters.
Preliminarily, consumer sentiment dropped 3.3 points m/m in October to 87.9 – the lowest since 86.9 in October 2014. Sentiment peaked at 98.1 in January 2015, which was an 11-year high.
Four FOMC members are scheduled to speak on Monday.
Currently net long 3.4k, up 4.4k.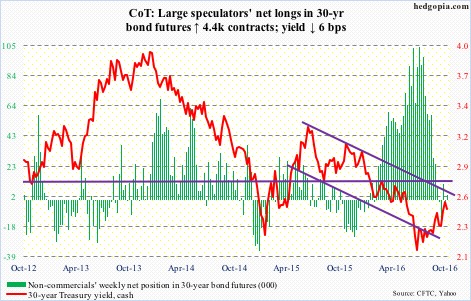
Crude oil: This time of the year, it is normal for U.S. crude inventory to build. Refineries go into maintenance, producing less fuel products.
In the week through October 14, refinery utilization did indeed drop five-tenths of a point, to 85 percent – the lowest since April 26, 2013.
Distillate stocks fell too, by 1.2 million barrels to 155.6 million barrels – a seven-week low.
But gasoline stocks rose, by 2.5 million barrels to 228 million barrels – a five-week high.
The surprise of all, crude stocks fell by 5.2 million barrels to 468.7 million barrels. This was the lowest since January 22 this year. Crude stocks have dropped by 26.5 million barrels in the last seven weeks, and refinery utilization by 8.5 percentage points in the last six.
Perhaps contributing to the large weekly drop in crude stocks was crude imports, which fell a whopping 954,000 barrels per day to 6.9 million b/d – the lowest since June 19, 2015.
Production rose a tad, by 14,000 b/d to 8.5 mb/d. Production peaked at 9.61 mb/d in the June 5th week last year.
Traders on Wednesday decided to focus on the drop in crude stocks/imports not the increase in gasoline stocks. Spot West Texas Intermediate crude rallied 2.4 percent in that session, past the June 9th high of $51.67/barrel. XLE, the SPDR energy ETF, tagged along, up 1.4 percent, but substantially off session highs.
Since February lows, spot WTI has been making higher lows, and would have been an interesting development should it convincingly push past the June 9th high for higher highs. The problem is, it has fatigue written all over, with a daily bearish MACD crossover.
Currently net long 378.5k, down 2.8k.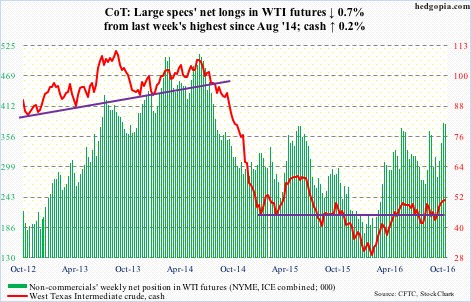
E-mini S&P 500: The 2120 support was tested again this week and held. But equity bulls were unable to fully take advantage of the daily oversold conditions.
Flows continue to be a problem. In the week ended Wednesday, SPY, the SPDR S&P 500 ETF, lost $206 million. In the prior week, outflows were $1.8 billion (courtesy of ETF.com).
In the same week, another $3.4 billion came out of U.S.-based equity funds (courtesy of Lipper). The S&P 500 peaked at 2193.81 on August 15; since the week ended August 17, north of $40 billion has left these funds.
Currently net long 23k, up 56.9k.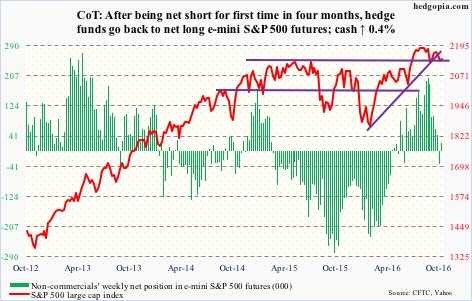
Euro: The ECB met Thursday, leaving interest rates unchanged. No change was expected. Consensus expects announcement of more stimulus in the December meeting. The current €80-billion/month program runs through March, or beyond, if necessary.
Post-meeting, Mario Draghi, ECB president, said that extension of the QE was not discussed at the meeting, but that the bank would continue to have substantial monetary policy support.
Not knowing how to react, the euro whipsawed Thursday between 110.39 and 109.14, in the end closing down 0.4 percent to 109.28, followed by another 0.4-percent drop on Friday.
Last week, the euro lost the November 2015 rising trend line. Since May this year, it has been making lower highs, and now has lower lows.
Currently net short 109.3k, up 15.8k.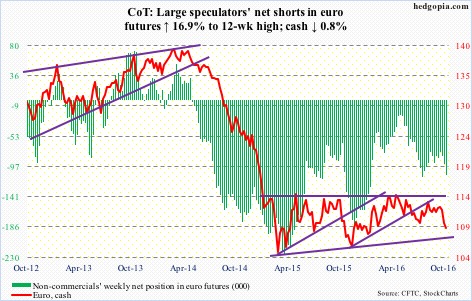
Gold: After five dojis in nine sessions around its 200-day moving average, GLD, the SPDR gold ETF, rallied past the average on Wednesday, that too with a doji. The 200-day is still rising. But the 50-day is dropping – currently $1,312.2 on spot gold, 3.5 percent away. It is worth recalling that the 3.3-percent, October 4th drop in spot gold came in a session in which $1,300 support was lost – around where a tug of war is likely.
On a daily chart, the spot just completed a bullish MACD crossover.
In the week ended Wednesday, $336 million moved into GLD. In the prior week, it attracted $455 million, (courtesy of ETF.com).
Currently net long 179.6k, down 15.6k.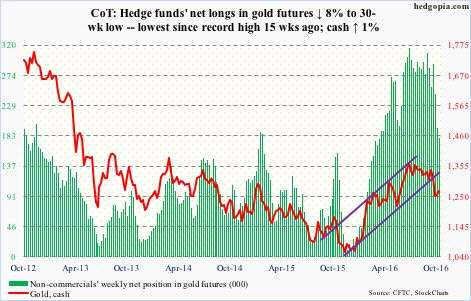
Nasdaq 100 index (mini): Alphabet (GOOGL) and Facebook (FB) jumped to fresh highs. They respectively report next Thursday and the followiing Wednesday. A lot has been built in. Post-earnings, Microsoft (MSFT), too, surged to a new high. Intel (INTC), whose outlook disappointed, was treated differently; the stock collapsed 5.9 percent on Wednesday, followed by another one-percent drop in the next two which both produced long-legged dojis.
Last week, the Nasdaq 100 index reached a new record high of 4904.72 before coming under pressure; that said, 4740 support was defended. Several big honchos are yet to report – which will decide the Nasdaq 100’s near-term path. It has charted out a broadening formation, and is currently kissing the top end.
In the week through Wednesday, QQQ, the PowerShares Nasdaq 100 ETF, managed to attract $177 million, coming on the heels of outflows of $926 million in the prior two (courtesy of ETF.com).
Non-commercials have built the most net longs.
Currently net long 157.1k, up 27.8k.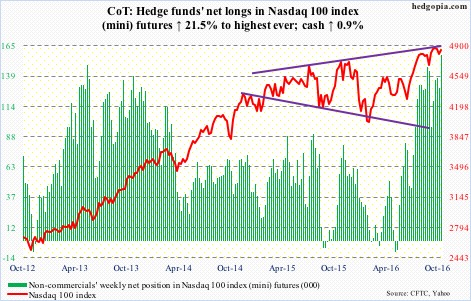
Russell 2000 mini-index: IWM, the iShares Russell 2000 ETF, attracted $1.4 billion in the week ended Wednesday – the largest weekly inflows since the week ended August 10 – and followed outflows of $718 million in the prior two (courtesy of ETF.com).
Support at 1200-plus was tested again this week, and it held. The 50-day moving average – flattish to slightly down – lies at 1236.57, which is 1.5 percent away.
Currently net long 8.1k, down 4.8k.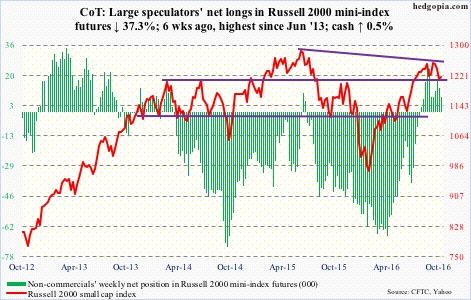
US Dollar Index: Non-commercials raised net longs to a 10-month high. Momentum is intact on the cash, with shorter-term averages still rising, and should continue to provide support near-term, even though daily momentum indicators are way overbought.
In a larger scheme of things, the spot continues to trade within $100-plus and $93-plus, with nice price action of late and a ‘higher lows, higher highs’ pattern.
Currently net long 45.4k, up 11.9k.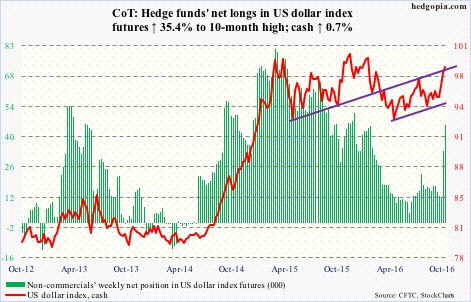
VIX: Spot VIX lost 17.3 percent for the week even as the S&P 500 was only up 0.4 percent.
Between an intra-day high of 17.95 on October 13 and a low of 13.27 this Friday, VIX lost 4.68 points, with the S&P 500 rallying 1.6 percent from low to high during the period. Equity bulls probably failed to cash in on volatility compression.
In the last three sessions, the equity put-to-call ratio was in the .50s.
The VIX-to-VXV ratio similarly dropped from 0.97 using intra-day highs on October 13 to 0.83 on Friday. A drop into the low-0.80s/high-0.70s pushes the ratio into oversold territory.
Despite the drop in VIX this week, it has been making higher lows since August 9; that trend line will not be tested until 12.50.
Currently net short 74.6k, down 13.4k.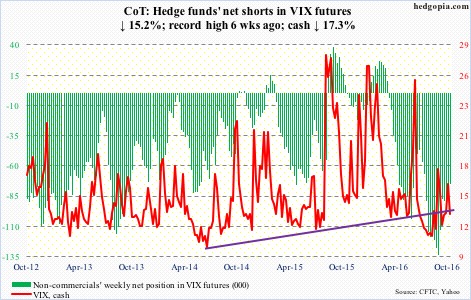
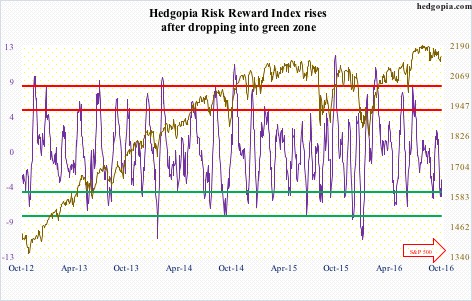
Hedgopia Risk Reward Index