Following futures positions of non-commercials are as of November 8, 2016.
10-year note: The 25-basis-point hike in the Fed funds rate last December was the first in nine-plus years. At 0.4 percent, rates are still zero-bound. Growth remains sluggish, but the economy is in its eighth year of expansion.
During campaign, president-elect Donald Trump has been critical of this ultra-easy monetary policy, and of Janet Yellen, Fed chair.
Markets expect the fed to tighten in December (13-14), but they also expect the bank not to get way too hawkish.
On Wednesday last week, post-election, the yield curve steepened. The 10-year yield shot up 21 basis points to 2.07 percent, rising further by Monday to an intra-day high of 2.27 percent – the highest since December last year. The long end of the curve is beginning to smell reflation thanks to Mr. Trump’s focus on infrastructure spending.
In this scenario, the Fed has room to get hawkish – not only to pacify Mr. Trump but also to fill its monetary quiver with conventional arrows. Plus, there are two vacancies in the board of governors that he can fill, which potentially changes the board’s complexion going forward.
Currently net short 71.7k, up 36.6k.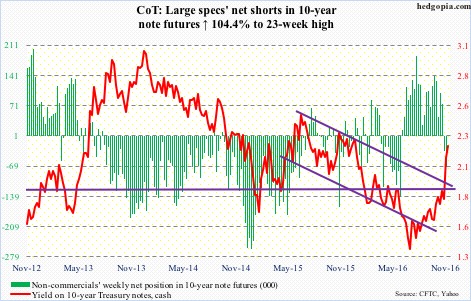
30-year bond: Major economic releases this week are as follows.
Retail sales for October are published later this morning. September rose 0.6 percent month-over-month to a seasonally adjusted annual rate of $459.8 billion. Sales increased 2.8 percent year-over-year.
Wednesday brings PPI-FD (October), industrial production (October), the NAHB housing market index (November), and the Treasury International Capital data (September).
Producer prices increased 0.3 percent m/m in September, and core inflation rose 0.2 percent. Over the past year, the PPI rose 0.7 percent, and core PPI 1.5 percent.
Through September, industrial production has shrunk y/y for 13 consecutive months, and capacity utilization for 19 straight months. Utilization was 75.4 percent in September, having reached a cycle high 78.9 percent in November 2014.
The NAHB builder sentiment was down two points m/m to 63 in October. September matched 65 in October 2015, which was a 10-year high.
In August, foreigners purchased $2.7 billion in U.S. equities – the second straight positive month after five negative months. On a 12-month running total basis, they were still net-selling in August – $84 billion worth. But this was down from record -$139 billion in February this year. Equities bottomed back then.
CPI (October) and housing starts (October) are reported on Thursday.
Consumer prices rose 0.3 percent m/m in September; core CPI inched up 0.1 percent. In the 12 months through September, CPI and core CPI increased 1.5 percent and 2.2 percent, respectively. Core CPI has risen in excess of two percent y/y for 11 straight months.
Starts dropped nine percent m/m in September to a seasonally adjusted annual rate of 1.05 million units. Starts were 1.22 million in July this year – the highest since October 2007, and essentially on par with 1.21 million in February this year and in June last year.
As many as 13 FOMC members are scheduled to speak on weekdays, including Ms. Yellen on Thursday.
Currently net short 2.7k, down 1.5k.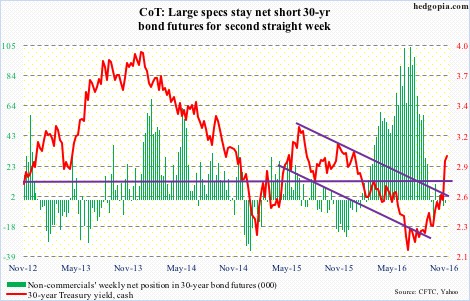
Crude oil: During Wednesday’s (last week) wild trading, spot West Texas Intermediate crude whipsawed between $43.07/barrel and $45.95, in the end rallying 0.6 percent to $45.27. Support at $43-plus goes back to January 2015. During the session, the spot also briefly lost the 200-day moving average before recapturing it. Daily technicals are oversold. The 50-day moving average lies at $47.24.
In the EIA report out on Wednesday, traders for the second week focused on the positives.
Gasoline and distillate stocks dropped – by 2.8 million barrels and 1.9 million barrels to 221 million barrels and 148.6 million barrels, respectively. Gasoline stocks were the lowest since mid-December last year, and distillates the lowest since early December last year.
Crude imports fell by 1.6 million barrels per day to 7.4 mb/d. And refinery utilization rose by 1.9 percentage points to 87.1 – a five-week high.
On the other hand, crude stocks increased by 2.4 million barrels to 485 million barrels, to a 10-week high. Stocks have gone up by nearly 17 million barrels in the past couple of weeks.
In the most recent sell-off, the spot broke a rising trend line from February this year, as well as support at $46, which oil bulls need to recapture to rebuild momentum.
Currently net long 242.9k, down 71.4k.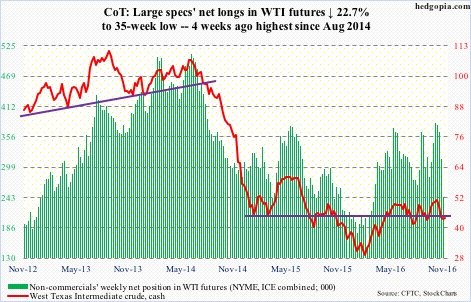
E-mini S&P 500: On Wednesday morning last week, as it was increasingly becoming apparent that Mr. Trump would pull an upset victory, the Dow Industrials was down 800-plus points, while the S&P large cap index hit limit down. Buyers then gradually showed up, and the pace quickened as the president-elect began his acceptance speech and particularly when he emphasized the need for infrastructure spending. All this took place pre-open; in the regular session, the index rose 1.1 percent.
On pre-election Friday, the S&P 500 closed right on its rising 200-day moving average. On Wednesday last week, it shot past the now-slightly-declining 50-day moving average, and 2120 was recaptured.
That said, Thursday produced a long-legged doji near the upper Bollinger band. That session was also a backtest of the broken trend line from February this year. This is a perfect spot for things to pause/reverse – at least near term. Monday produced a spinning top.
Leading up to this, in the week through Wednesday last week, SPY, the SPDR S&P 500 ETF, saw huge inflows of $5.5 billion (courtesy of ETF.com). This was followed by another $7.7 billion on Thursday and Friday, with the cash going nowhere in those two sessions.
In the same week, $265 million moved into U.S.-based equity funds (courtesy of Lipper). In the prior five, $36 billion was redeemed.
Currently net short 3.3k, down 17.4k.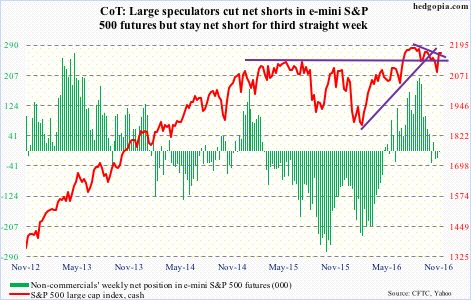
Euro: The European Commission cut its Eurozone growth forecast by 0.3 percent to 1.5 percent for 2017. This year, growth is expected to come in at 1.7 percent. The forecast was made on Wednesday last week, the same day when, reacting to U.S. election results, the euro was sold hard, down 1.1 percent to 109.17, past support at 109.5. It ended the week at 108.87, and dropped another 1.1 percent on Monday to 107.38.
The cash sits precariously at a slightly rising trend line from March last year.
Currently net short 129.3k, down 8.1k.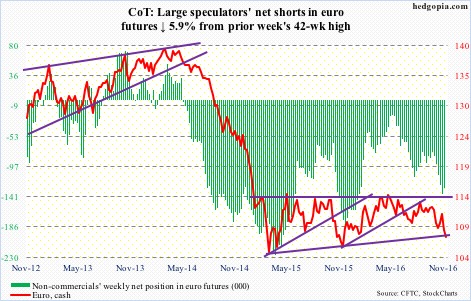
Gold: The spot had a rollercoaster ride on Wednesday last week – closed at $1,273.5, down 0.1 percent, with a high of $1,338.3 and a low of $1,268.1. The session high kissed the underside of the falling trend line drawn from the July 6th high of $1,377.5 and was rejected. Both 50- and 200-day moving averages were lost, as well as support at $1,300.
GLD, the SPDR gold ETF, is not succeeding in attracting funds as it was early this year. In the week through Wednesday last week, $419 million came in, but on Thursday and Friday $840 million was redeemed (courtesy of ETF.com). From October 7 when the metal began its latest rally attempt through last Friday, $528 million came out of the ETF.
Currently net long 217.2k, up 2.1k.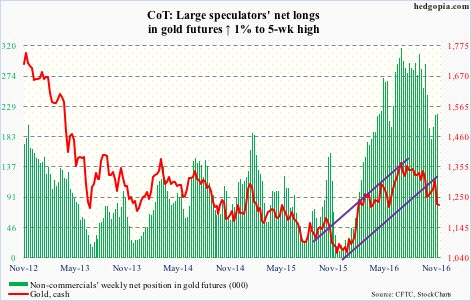
Nasdaq 100 index (mini): On Monday last week, when the Nasdaq composite rallied 2.4 percent, the advance-decline ratio was a respectable four (2269 advancers versus 564 decliners). Post-election, the index rallied another 1.1 percent on Wednesday, with the ratio dropping to 2.6.
Short-covering probably played a major role in the Wednesday rally in particular. Leading up to this, in the October 17-31 period, Nasdaq short interest rose 1.4 percent to a three-month high.
Interestingly, on Monday last week, QQQ, the PowerShares Nasdaq 100 ETF, jumped 2.4 percent, but the ETF lost $597 million (courtesy of ETF.com). On Wednesday, it only attracted $287 million. For the week ended Wednesday, it lost $1.0 billion. This followed inflows of $2.3 billion in the prior three weeks.
The Nasdaq 100 acts poor. Non-commercials had massive holdings of net longs, which are being cut.
Currently net long 101.6k, down 30.1k.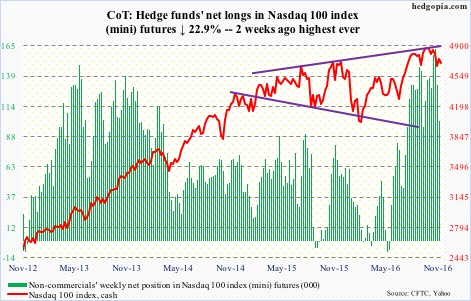
Russell 2000 mini-index: A declining trend line drawn from an all-time high of 1296 reached in June 2015 was taken out last week. Yesterday, that high was conquered as well, rising to a new high of 1306.56 (closed at 1298.6).
There is room to rally on a weekly basis, but the daily chart is way extended, with the RSI moving from sub-30 early this month to north of 70.
Flows are cooperating. In the week ended Wednesday last week, IWM, the iShares Russell 2000 ETF, gained $1.3 billion. Then on Thursday and Friday, another $3 billion came in.
Non-commercials probably contributed as well. Just before the post-election rally, they raised net shorts to a 17-week high.
Currently net short 19k, up 11.5k.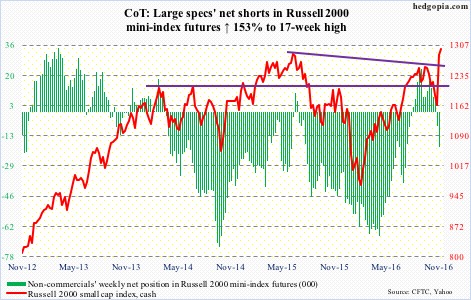
US Dollar Index: After a nine-month, 25-percent rally into the March 2015 high of 100.71, the cash has been range-bound, with a slightly declining trend line from that high obstructing rally attempts. That trend line got kissed from underneath last week, and was taken out yesterday. At 100.12, the cash is within spitting distance of the March 2015 high.
It is hard to tell which way non-commercials are leaning, as their holdings do not reflect post-election reaction in the currency market. That said, they hold substantially fewer net longs versus what they held near the March 2015 high.
Currently net long 52.3k, down 2k.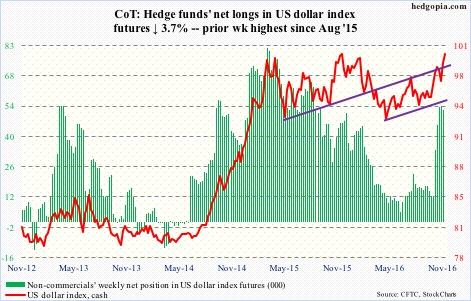
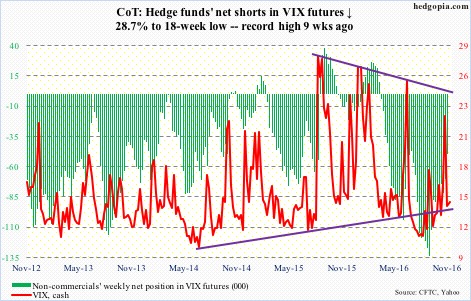
VIX: Spot VIX’s rally streak of a record nine consecutive sessions ended on Monday last week. Wednesday, it collapsed over 23 percent, dropping to 13-plus on Thursday before finding support at a rising trend line from August 9 this year.
Pre-election, protection was in high demand – which got quickly unwound.
The VIX-to-VXV ratio dropped to 0.86 from 1.07 on Friday last week. It is not severely oversold, but in the past has managed to rally from these levels.
Currently net short 49.9k, down 20.1k.