Following futures positions of non-commercials are as of November 22, 2016.
10-year note: Like that, 10-year Treasury yields rallied north of 100 basis points in four and a half months – from the all-time low 1.34 percent on July 6 through 2.42 percent last Thursday! Yields are still trapped within a three-decade-old descending channel – will test the upper end around three percent.
On a monthly chart, there is room for yields to continue moving higher. Daily and weekly charts, however, are way extended, with signs of fatigue showing up on the daily.
In the meantime, TLT, the iShares 20+ year Treasury bond ETF, is itching to move higher. Since it unsuccessfully tested the 200-day moving average early this month through the low last Thursday, TLT ($121.71) lost just under 10 percent. In the right circumstances, it has a shot at gap-down resistance between $127.5 and $130.
Currently net long 172.6k, up 35.3k.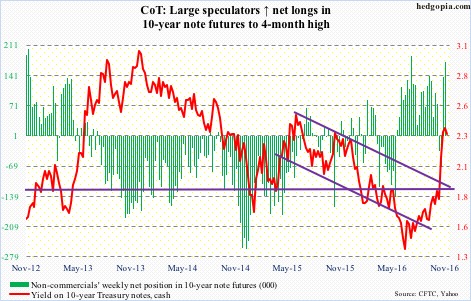
30-year bond: Major economic releases this week are as follows.
On Tuesday (today), we get GDP (3Q16, 2nd estimate), corporate profits (3Q16, preliminary estimate), and the S&P Corelogic Case-Shiller housing price index (September).
The first estimate showed real GDP grew by 2.9 percent in 3Q16. This was the fastest growth rate since 3Q14. Post-Great Recession, growth has only averaged 2.1 percent, versus 3.2 percent going all the way back to 2Q47.
Corporate profits adjusted for inventory and depreciation in 2Q16 inched lower quarter-over-quarter by 0.6 percent to a seasonally adjusted annual rate of $2.02 trillion. Profits peaked at $2.22 trillion in 2Q14.
Home prices nationally rose at an annual rate of 5.3 percent in August. Prices have been rising in the five-percent range for two years now.
Personal income (October) and pending home sales (October) are due on Wednesday.
In September, core PCE inflation – the Fed’s favorite measure of consumer inflation – rose at an annual rate of 1.7 percent. It has been rising since July last year when it rose by 1.31 percent. That said, the last time it increased at north of two percent was in April 2012.
The pending home sales index was up 1.6 points month-over-month to 110 in September. The cycle high was reached in April this year at 115 – the highest since 115.4 in March 2006.
Thursday brings the ISM manufacturing index for November. In October, it inched higher m/m by four-tenths of a point to 51.9. Orders, however, dropped by three points to 52.1.
November’s employment report comes out on Friday. Non-farm payroll only grew by 161,000 in October – slower than the monthly average this year of 181,000 and definitely slower than the 2015 average of 229,000 and 251,000 in 2014.
Currently net long 234, up 4.1k.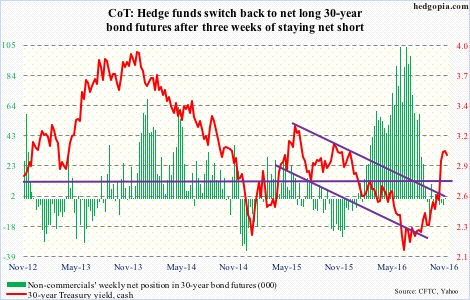
Crude oil: Amidst all the optimism around the November 30 OPEC meeting comes news that both Iran and Iraq are seeking exemptions from production cutback plans. Combined, the two produce nearly a quarter of OPEC production.
In Algiers in September, OPEC decided to cut production to between 32.5 million barrels per day and 33 mb/d. The IEA puts August production at 33.5 mb/d. Since then, an increase in Libyan and Nigerian production has boosted output to 33.8 mb/d. Even to get to the goal reached in Algiers, the amount that needs to be cut has gone up.
If those two nations are merely jawboning for a higher quota and OPEC, with the help of Russia, somehow reaches a deal tomorrow, markets will probably focus on if it is a one-year or six-month deal. A shorter-term deal has potential to be influenced by temporary factors such as production decline in Saudi Arabia over the winter. Oil bulls would need more than just a face-saving deal.
Amidst this, in the week ended November 18, U.S. crude stocks fell by 1.3 million barrels to 489 million barrels. The prior week was at an 11-week high.
Crude imports dropped, too, by 845,000 barrels per day to 7.6 million b/d.
Refinery utilization rose by 1.6 percentage points to 90.8 – a nine-week high.
Crude production, however, rose a tad, by 9,000 b/d, to 8.7 mb/d.
Gasoline and distillate stocks rose – by 2.3 million barrels to 224 million barrels and by 327,000 barrels to 149.2 million barrels, respectively.
Where crude oil goes from here depends on what comes out of the meeting tomorrow. Ahead of that, spot West Texas Intermediate crude last week rallied 3.5 percent, and past support-turned-resistance $46-plus. That said, Tuesday (last week) produced a spinning top, followed by a long-legged doji – right outside the 50-day moving average. Traders are indecisive.
Currently net long 292.4k, up 19k.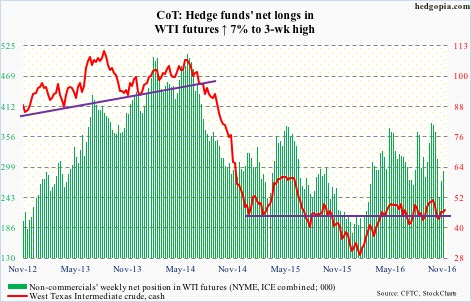
E-mini S&P 500: In the week ended Wednesday last week, $2.2 billion was withdrawn from SPY, the SPDR S&P 500 ETF. Bulls were hoping that this would be the third straight week of inflows, but were disappointed. In the prior couple of weeks, a whopping $12.7 billion came in (courtesy of ETF.com).
Also in the week ended last Wednesday, $452 million moved into U.S.-based equity funds (courtesy of Lipper) – tiny compared to the massive $23.6 billion in inflows in the prior week … but inflows nonetheless.
The S&P 500 (cash) continued to grind higher last week – right along the underbelly of the rising, but broken, trend line from February this year. This also coincides with a slightly rising trend line from May last year. Sort of a make-or-break time for the index, even as daily conditions in particular are way overbought.
Currently net short 70.4k, up 56.5k.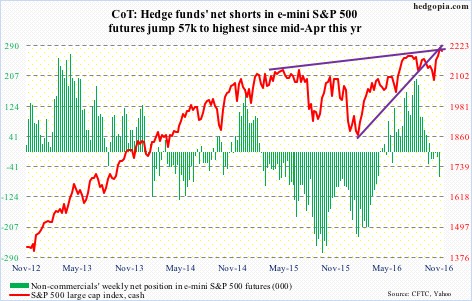
Euro: Eurozone PMI (IHS Markit) for November rose eight-tenths of a point m/m to 54.1, an 11-month high.
From intra-day high to low, the euro fell just over nine percent between early May and last Wednesday. It is possible the weak currency is helping manufacturing.
The shorter-term daily moving averages on the cash are still pointing down, but could be in the process of stabilizing. The daily RSI is beginning to diverge from the price.
Currently net short 119.3k, up 166.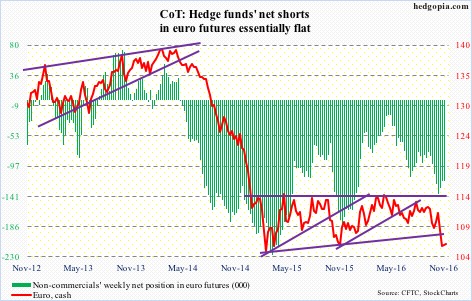
Gold: Time for gold bugs to step up to the plate.
On Wednesday last week, the cash dropped to $1170.3, before rising a tad. Support around here – $1,180-ish – goes back to November 2009. It is a must-hold.
Flows are still not helping. In the week ended Wednesday last week, GLD, the SPDR gold ETF, lost $1.4 billion, having lost $1.2 billion in the prior week (courtesy of ETF.com).
Needlessly to say, the metal is oversold, with the daily RSI sub-20 last Friday. A bounce is due. Should it push higher and sustain, it is possible it would be carving out the right shoulder of a three-plus-year inverse head-and-shoulders pattern.
Currently net long 167.1k, down 10.6k.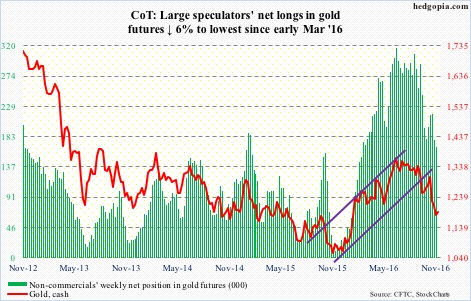
Nasdaq 100 index (mini): The Dow Industrials, S&P 500, Nasdaq composite and the Russell 2000 small cap index all broke out to fresh highs. Not the Nasdaq 100. Its October 25 all-time high of 4911.76 stands. Last Tuesday in a doji session, it rose to 4884.63, before coming under slight pressure, with Wednesday producing a hanging man.
In the week through last Wednesday, QQQ, the PowerShares Nasdaq 100 ETF, attracted $1.1 billion. This followed inflows of $126 million in the prior week (courtesy of ETF.com). Not bad, but inflows need to improve if the index were to perform better. It is still trapped within a megaphone pattern, and needs to hold 4840.
Currently net long 84.3k, up 12.9k.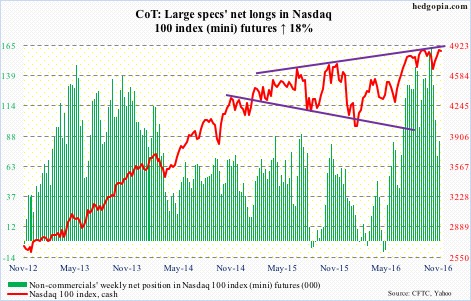
Russell 2000 mini-index: Small-caps continue to attract flows, although the pace has decelerated.
In the week ended Wednesday last week, IWM, the iShares Russell 2000 ETF, attracted $990 million. This on the heels of inflows of $4.5 billion in the prior week and $1.3 billion in the week before that (courtesy of ETF.com).
Post-Trump victory, the crowd has decided this is the place to be, and they are piling on – now joined by non-commercials. Even assuming they have a sound fundamental case – not a base case on this blog – the risk is they are pushing it. From November 3 through last Friday, the Russell 2000 (cash) rallied 16.5 percent in 15 straight sessions – reflecting fear of missing out. Good till it lasts, but seldom a good sign in a larger scheme of things! Especially when divergences show up.
Currently net long 34.2k, up 14.4k.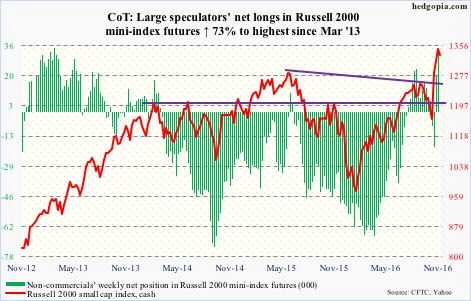
US Dollar Index: The cash broke out to a 13-year high – past prior two peaks of March and November last year. On a daily and weekly basis in particular, the dollar index is grossly overbought, and is beginning to flash signs of fatigue, with last week a spinning top.
It has also reached a crucial stage technically – .618 Fibonacci retracement of the January 2002-March 2008 decline. More often than not, this can be a spot where momentum can reverse, or at least pause.
Yesterday, there was a breakout retest. This was a first test and was successful, but it is unlikely this will continue to hold in the days/weeks to come.
Non-commercials have decided not to aggressively jump on the dollar bandwagon.
Currently net long 53.2k, up 4.8k.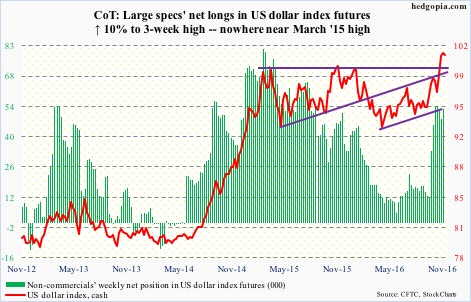
VIX: The VIX-to-VXV ratio closed last week at .796, following .828 in the week before that. In the past, there have been times when it has shot right back up. Other times, it has gone sideways after dropping into oversold zone. Equity bulls must be hoping it is the latter.
One thing that might come in the way of this scenario is that the VXST-VIX-VXV-VXMT curve is in steep contango, and this tends to precede pullbacks in stocks.
Currently net short 63.4k, up 14.2k.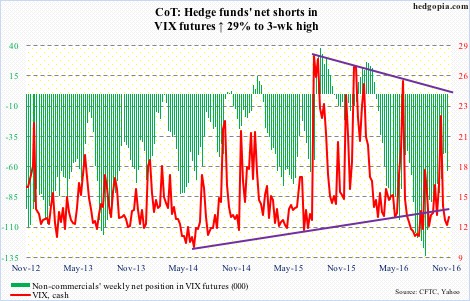
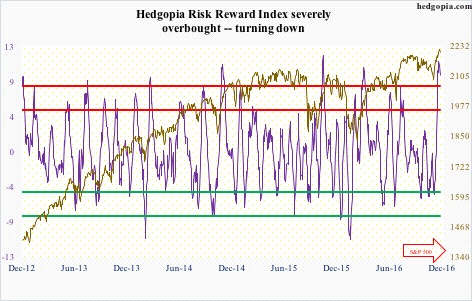
Hedgopia Risk Reward Index