Following futures positions of non-commercials are as of November 29, 2016.
10-year note: From the July 6 (this year) all-time low of 1.34 percent to the Thursday high of 2.49 percent, the 10-year Treasury yield jumped 115 basis point in less than five months. This week’s high tested the high from June last year. A breakout here will bring it one step closer to attacking three percent, which approximates the upper end of a three-decade-old descending channel.
Bonds have sold off, due largely to revival of growth hopes post-Trump victory. In this rosy scenario, higher rates make sense. But at what point do they end up hurting the economy – 2.5 percent, three percent, higher? Think autos, housing, and what have you.
This phenomenon is similar to what is going on in the oil pit. The OPEC deal lit a fire under crude oil. All good, but at what point does it end up hurting the consumer? Extra money paid at the pump will have to be offset by belt-tightening somewhere else.
Importantly, stocks – thus far – are neither worried about higher rates nor higher prices at the pump. The U.S. economy is too leveraged to comfortably bear these costs.
Currently net short 96.3k, up 268.9k.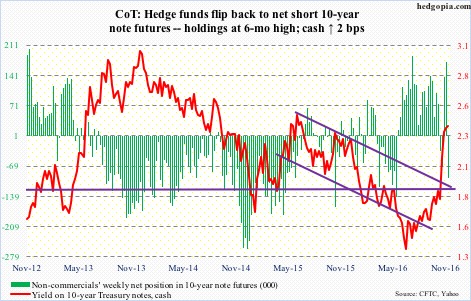
30-year bond: Major economic releases next week are as follows.
November’s ISM non-manufacturing index is published on Monday. Services activity dropped 2.3 points month-over-month in October to 54.8, orders fell by the same amount to 57.7.
Productivity (3Q16, revised) and durable goods (October, revised) come out on Tuesday.
Preliminarily, non-farm business sector output per hour rose at a 3.1-percent annual rate in 3Q16. This follows three consecutive quarters of negative growth. Productivity remains subdued.
Orders for non-defense capital goods ex-aircraft – proxy for business capital expenditures – grew 0.4 percent m/m in October to a seasonally adjusted annual rate of $63.1 billion, but contracted year-over-year for 12 straight months (and in 21 out of last 22 months). Orders peaked at $70.7 billion in September 2014.
JOLTS for October comes out on Wednesday. Job openings increased by 33,000 m/m in September to 5.49 million (SAAR). July was 5.83 million – essentially on par with 5.85 million in April and 5.79 million in July last year.
The University of Michigan’s consumer sentiment index for December (preliminary) is reported on Friday. November saw a spike of 6.6 points to 93.8 – a six-month high. Sentiment reached a cycle high 98.1 in January last year – an 11-year high.
Currently net short 24.3k, up 24.5k.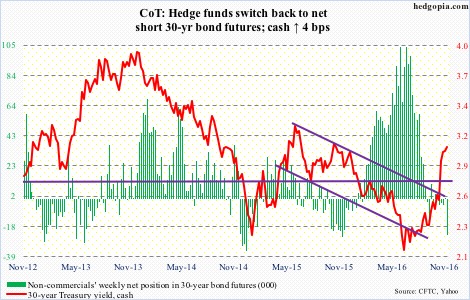
Crude oil: So OPEC does hash out a deal to cut production after all – first cut in eight years! It plans to reduce crude output by 1.2 million barrels per day by January. Even Russia, a non-OPEC member, will pitch in with a cut of as much as 300,000 b/d.
Markets were surprised. Spot West Texas Intermediate crude surged 9.3 percent on Wednesday, adding another 4.6 percent in the next two sessions. U.S. shale plays soared – with Continental Resources (CLR) up 23 percent and Whiting Petroleum up 30 percent on Wednesday, among others.
Therein lies the rub. Would the OPEC deal end up giving lifeline to the U.S. shale producers that were severely hurting by the low price?
Markets will also be on pins and needles whether or not all parties stick to the agreement. It is a six-month deal. OPEC will next meet on May 25 next year.
Spot WTI ($51.68) is literally sitting at resistance at $52-ish, which goes back two years, and makes up the neckline of a reverse-head-and-shoulders formation.
Wednesday’s EIA report for the week ended last Friday was mixed.
U.S. crude stocks were down 884,000 barrels to a three-week low 488.1 million barrels.
Crude imports fell, too, by 30,000 b/d, to 7.5 mb/d.
Other data points were not so positive.
Gasoline stocks rose by 2.1 million barrels to 226.1 million barrels, and distillate stocks by five million barrels to 154.2 million barrels.
Crude production rose by 9,000 b/d to 8.7 mb/d, and refinery utilization shrank one percentage point to 89.8.
Currently net long 300.4k, up 8.1k.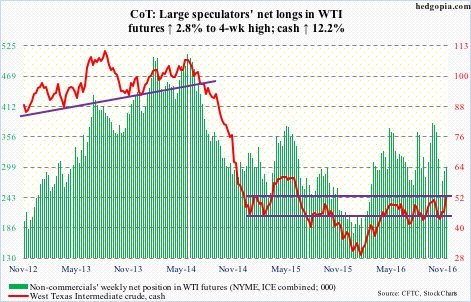
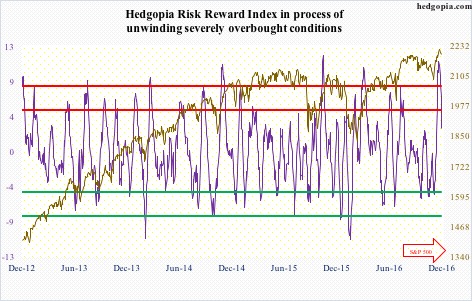
E-mini S&P 500: On Wednesday, post-OPEC decision, the cash rallied to a new all-time high of 2214.1, but was unable to hang on, closing down 0.27 percent. (The Dow Industrials similarly rose to a new all-time high of 19225.29, but closed the session essentially flat at 19123.58, in the process carving out a shooting star.)
The S&P 500 is in the process of unwinding extremely overbought daily conditions. The problem is, if equity bulls do not get their act together, this could wind up dragging the weekly indicators, now in overbought zone, down.
Flows are not helping. In the week ended Wednesday, $1.2 billion was withdrawn from SPY, the SPDR S&P 500 ETF. In the prior week, $2.2 billion was redeemed – which was preceded by two-week inflows of $12.7 billion (courtesy of ETF.com).
Also in the week ended Wednesday, $961 million came out of U.S.-based equity funds (courtesy of Lipper). In the prior three weeks, north of $24 billion came in.
Importantly, the S&P 500 is retreating from dual resistance – the underside of a rising, but broken, trend line from February this year and a slightly rising trend line from May last year.
Currently net short 139.3k, up 68.8k.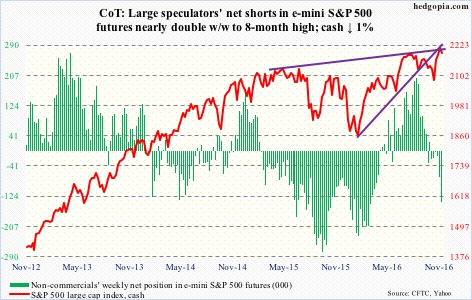
Euro: IHS Markit’s final Eurozone manufacturing PMI for November rose two-tenths of a point m/m to 53.7 – the highest since January 2014.
Separately, Eurozone consumer inflation rose a mere 0.6 percent y/y in November.
Markets expect the ECB to announce next week an extension to its asset purchase program. Should the bank oblige, it will probably cite inflation, not PMI.
In the meantime, the euro is trying to stabilize on a daily chart – itching to move higher. If the ECB disappoints next week, the stars are aligned for a reflex rally. There is gap-down resistance at just under 108.
Currently net short 119.2k, down 108.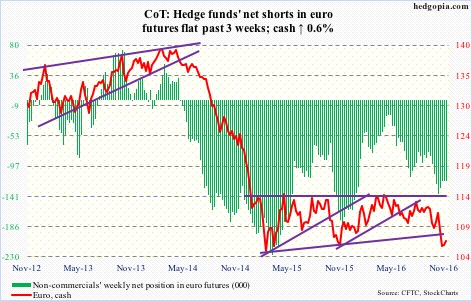
Gold: Between November 30 last year and July 5 this year, spot gold rallied nearly 32 percent. From that high through Thursday’s low, the metal gave back nearly 16 percent. This also retraced 61.8 percent of that earlier rally (at $1,172.3 to be precise).
For Fibonacci followers, this is a good spot for gold bugs to put their foot down. The metal is trying to stabilize, with the cash ($1,177.8) unchanged this week. Flows need to improve.
In the week ended Wednesday, GLD, the SPDR gold ETF, lost $294 million. In the prior two weeks, $2.5 billion was redeemed (courtesy of ETF.com).
Currently net long 151.6k, down 15.5k.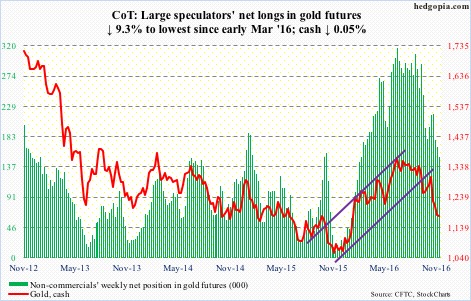
Nasdaq 100 index (mini): On Wednesday, when the S&P 500 and Dow Industrials rose to fresh highs, the Nasdaq 100 never got going, down 1.3 percent.
Large-cap tech has severely lagged the past three weeks. The October 25 all-time high of 4911.76 on the Nasdaq 100 still stands. On Wednesday, it also lost near-term support at 4840 as well as the 50-day moving average.
Support at 4740 is intact. Right around here lies a rising trend line from February this year – a must-hold.
In the week through Wednesday, QQQ, the PowerShares Nasdaq 100 ETF, did attract $220 million. But it is beginning to look like institutions are bailing out. They were not willing to defend 50-DMA.
Currently net long 89.3k, up 5k.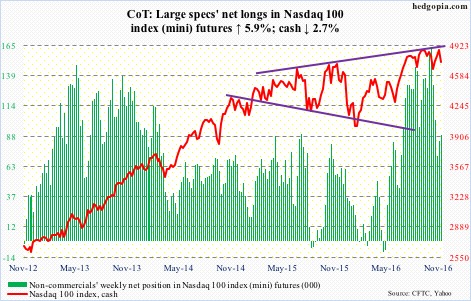
Russell 2000 mini-index: After 15 consecutive up sessions, during which it rallied 16.5 percent (!), the cash began the week with a solid red candle. There is potentially a lot of unwinding left in the days/weeks to come.
Non-commercials, in the meantime, have accumulated record net longs. The Russell 2000 (cash) lost 2.5 percent in the week. These traders’ patience is being tested.
The nearest support lies around 1300 – 1296 was the June 2015 high, which the the index broke out of on November 14. If flows do not cooperate, this potentially gets tested in no time.
In the week ended Wednesday, IWM, the iShares Russell 2000 ETF, lost $210 million. In the prior three, it attracted $6.8 billion (courtesy of ETF.com).
Currently net long 39k, up 4.8k.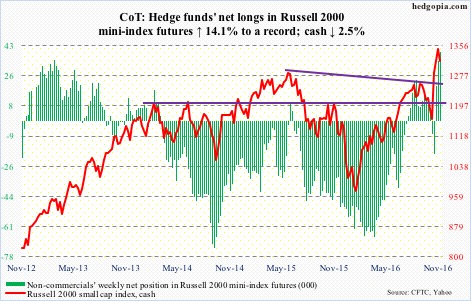
US Dollar Index: Eleven sessions ago, the cash broke out to a 13-year high – past prior two peaks of March and November last year. Since that breakout, the resistance-turned-support has been tested several times already, and closed the week literally on that support.
Dollar bulls have expended lots of energy in rallying the index past 100. Since May this year, it jumped 11 percent.
This will have repercussions for U.S. exports and corporate earnings, among others.
Technically, .618 Fibonacci retracement of the January 2002-March 2008 decline lies at 101.74. Its high last week was 101.97. Plus, non-commercials have pretty much decided to sit out this recent rally. On a daily chart, the dollar index just had a bearish MACD crossover.
It will be awfully difficult to save the afore-mentioned support.
Currently net long 53.4k, up 214.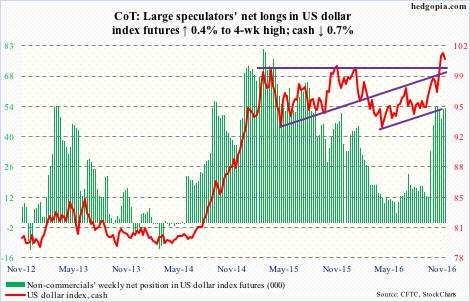
VIX: The VIX-to-VXV ratio began to rise on Wednesday after hitting .794 intraday. Last week, it dropped to .796, which was preceded by .828 in the week before that. These are low readings, and will need to get unwound. The question is, when would that process begin? In the past, the ratio has gone sideways for several more weeks even after dropping into oversold zone.
Spot VIX acts like it wants to push higher, with a bullish MACD crossover on a daily chart. In this scenario, VIX:VXV probably rallies.
Currently net short 67.7k, up 4.3k.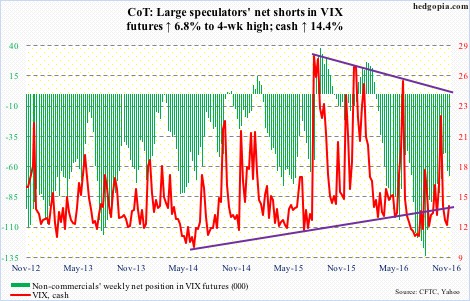
Hedgopia Risk Reward Index