Following futures positions of non-commercials are as of December 20, 2016.
10-year note: Ten-year Treasury yields peaked at 15.8 percent in September 1981, then dropping to 1.39 percent by July 2012. In July this year, those lows were slightly undercut; the 10-year dropped to 1.34 percent. Since that low through last Thursday’s’ high of 2.62 percent, yields went up by 128 basis points – and by 80 basis points since Donald Trump won the election. Quite an increase in such a short span of time!
Despite this, longer-term, yields are still trapped within a three-decade-old descending channel, the upper end of which will be tested just north of three percent – and progressively lower as time passes. Regardless whether or not a test will occur next year – or even a breakout ensues – right here and now yields (2.54 percent) are likely headed lower.
Particularly post-election, the yield curve has priced in a lot of optimism – as relates to economic growth, inflation, corporate earnings, and what have you. Time to digest those gains – lots of unwinding left on particularly daily and weekly basis. Nearest decent support lies at 2.19 percent (gap-up), which also approximates the 50-day moving average at 2.16 percent.
Currently net short 221.1k, down 47.3k.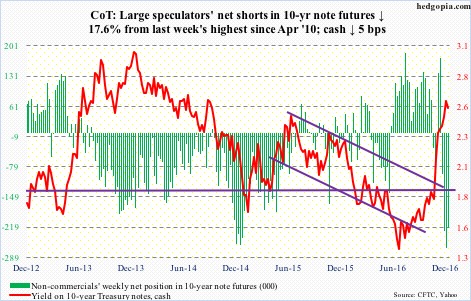
30-year bond: Major economic releases next week are as follows. It is a holiday-shortened week. Happy Holidays and Merry Christmas!
Tuesday brings the S&P Corelogic Case-Shiller U.S. home price index for October. Nationally, prices rose at 5.5 percent year-over-year in September, and have grown in the four to five percent range for just over two years now.
November’s pending home sales are due out on Wednesday. The index rose one-tenth of a point month-over-month in October to 110. The cycle high 115 was reached in April this year, which was the highest since 115.4 in March 2006.
Currently net short 11.3k, down 4.2k.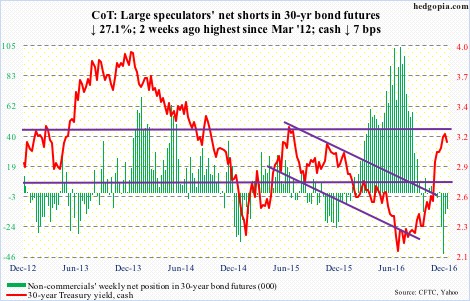
Crude oil: Markets interpreted Wednesday’s EIA report as negative. Spot West Texas Intermediate crude lost 1.5 percent in that session.
In the week ended last Friday, crude stocks did indeed rise 2.3 million barrels to 485.4 million barrels. As did crude imports, which increased by 1.1 million barrels per day to 8.5 mb/d – a seven-week high.
On the positive side, both gasoline and distillate stocks fell – by 1.3 million barrels to 228.7 million barrels and by 2.4 million barrels to 153.5 million barrels, respectively.
Crude production fell, too, but just by 10,000 b/d to 8.8 mb/d. And refinery utilization rose one percentage point to 91.5 – a 13-week high.
Coming into the week, spot WTI was beginning to look fatigued, with a long-legged weekly doji last week and a doji before that. This week produced another dojj. Since it bottomed in early February this year, it has more than doubled, and in the process has carved out a potentially bullish inverse head-and-shoulders pattern. Odds favor it does not complete – at least not in the near term.
Currently net long 434.4k, up 8k.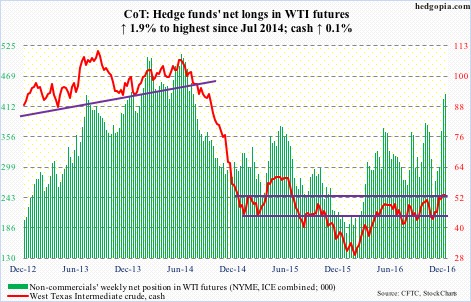
E-mini S&P 500: In the week ended Wednesday last week, SPY, the SPDR S&P 500 ETF, attracted $8.3 billion; this followed $4.5 billion in the week before that. The S&P 500 was essentially unchanged last week. In the week through Wednesday this week, $584 million came out of the ETF (courtesy of ETF.com).
Therein lies the risk for the bulls. North of $19 billion moved into SPY post-election. Those that got in early are doing fine, but not the ones that jumped on the rally bandwagon the past couple of weeks, as the cash has essentially gone sideways. For the newbies to continue to do well, the ETF should continue to attract new funds. Otherwise, they grow impatient.
Also in the week through Wednesday, $21.6 billion came out of U.S.-based equity funds (courtesy of Lipper).
In the meantime, the cash continues to show signs of fatigue. Last week was a doji. This week, the index at one time was up 0.6 percent, but ended up 0.25 percent. There is a bearish MACD cross under on the daily chart.
Currently net short 34.9k, down 83.8k.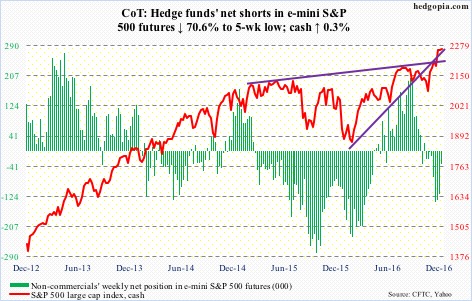
Euro: The private sector’s attempt in Italy to raise €5 billion for troubled Banca Monte dei Paschi di Siena failed. This was followed by the Italian parliament’s €20-billion bailout fund for its besieged banking sector. Over in Greece, the government doled out €600 million in Christmas bonus for low-income pensioners. Consequently, funding under a €86-billion Eurozone rescue facility, agreed last year, was suspended.
Signs of flaring Eurozone problems? Possible. Next year, a lot can happen. Among others, both Germany and France have elections.
Last week, the euro (cash) lost horizontal support going back to March last year; 104.62 was the low back then. This week, the broken support resisted a rally attempt in four of five sessions. That said, the cash is trying to stabilize. Resistance to watch: 105-plus.
Currently net short 78k, down 9.5k.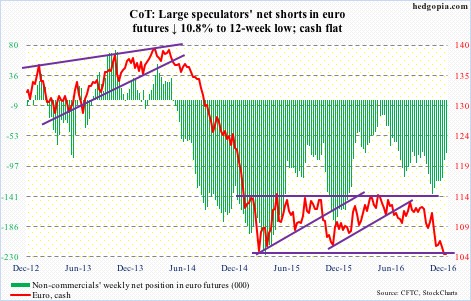
Gold: GLD, the SPDR gold ETF, cannot catch a break. In the week ended Wednesday, it lost another $911 million (courtesy of ETF.com). This was the sixth straight week of redemptions, during which $5 billion was withdrawn.
This obviously has not helped the metal. Plus, non-commercials continue to cut back net longs.
The cash ($1,133.6/ounce) is grossly oversold on a daily and weekly basis, but support is not being defended. Gold bugs were unable to defend the .618 Fibonacci retracement of the November 30 (2015)-July 5 (2016) rally on the cash. That support lied at $1,172.3.
Shorter-term moving averages continue to drop. Ditto with the lower Bollinger band. If there is any consolation for the gold bugs, it is that last week’s low of $1,124.3 is holding, with sideways action in the subsequent six sessions.
Currently net long 114.8k, down 14.5k.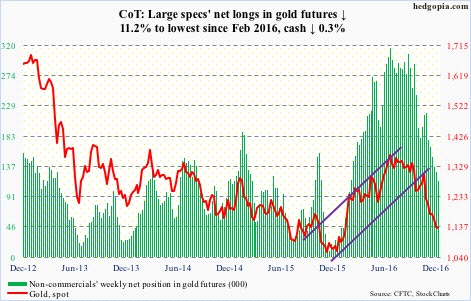
Nasdaq 100 index (mini): On October 25 this year, the cash reached a new high of 4911.76. It was not until December 13 it surpassed that high. Post-election, the Nasdaq 100 went sideways for nearly a month, even as other major U.S. indices were scoring new highs.
Unlike small-caps, the tech-heavy Nasdaq 100 is not conveying a risk-on message. From November 9 through December 21, $2.2 billion moved into QQQ, the PowerShares Nasdaq 100 ETF, versus $5.6 billion into IWM, the iShares Russell 2000 ETF, and $19.4 billion into SPY.
That said, since the December 13th breakout, $3 billion has moved into QQQ. Bulls for sure hope this continues.
For now, they have to wrestle with the daily momentum indicators that are itching to go lower.
Currently net long 74.9k, down 2.2k.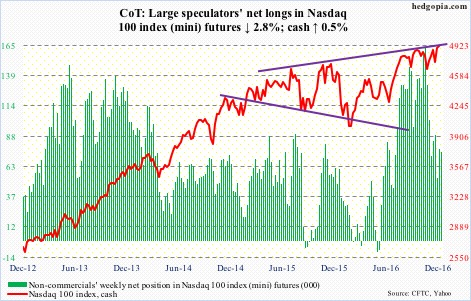
Russell 2000 mini-index: In the week ended Wednesday, IWM attracted $238 million, following $278 million in inflows in the prior week (courtesy of ETF.com). The Russell 2000 (cash) peaked two weeks ago. The longer it fails to rally – or even goes sideways – the more restless this money grows. As noted above, post-election, the ETF attracted $5.6 billion.
On the daily chart, the index carved out a lower high this week – 1385.06 on December 20 versus 1392.71 on December 9. Near-term support lies at 1347. A test of that support – probable – ensures lower lows on the cash.
Notably, in the week ended Tuesday, non-commercials’ net longs surged 65 percent to 92,433 contracts – yet another record. The cash only managed a 0.76-percent rise during those five sessions. In due course, bears will have a field day when this reverses, and it will – just a matter of time.
Currently net long 92.4k, up 36.5k.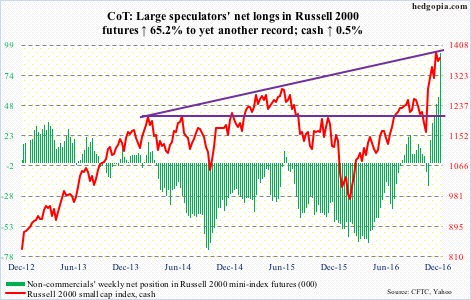
US Dollar Index: The dollar index peaked at 100.71 in March last year. That level was unsuccessfully tested in November that year, and later again this November. A breakout occurred on November 17. Successful breakout retest has taken place in the past four weeks. In fact, 102 is the new near-term support.
The US Dollar index had been rising since May this year. But post-election, the rally has taken a life of its own – up north of five percent. Dollar bulls accordingly have expended lots of energy on this.
Odds favor the afore-mentioned 102 support gets tested in the days to come – and possibly another retest of the November 17th breakout.
Currently net long 52.4k, down 4.3k.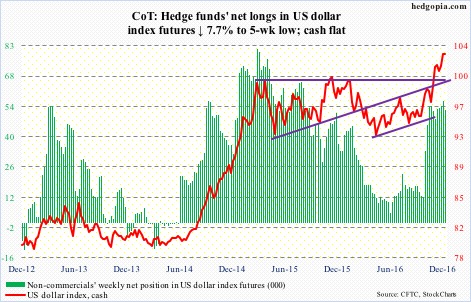
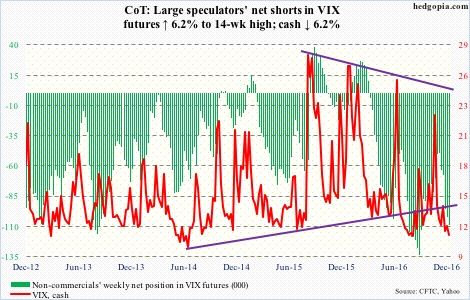
VIX: The cash went sub-11 on Wednesday, dropping to 10.93 in the opening minutes, before finding support at the daily lower Bollinger band and closing at 11.27. This was the lowest since 10.88 on August 5 last year. Back then, the S&P 500 from intra-day high to low collapsed 11.2 percent in five sessions between August 18 and 24.
Also on Wednesday the VIX-to-VXV ratio dropped to .747, followed by .748 on Thursday, and .75 on Friday. These are very low readings. The ratio has been in the .70s in three of the past four weeks, and in high .70s/low .80s in the past six. Unwinding of these oversold conditions is a matter of when not if.
Elsewhere, the 21-day moving average of CBOE equity put-to-call ratio bottomed at .587 on December 12. This is low enough reading to begin unwinding. The ratio ended the week at .606, with lots of room to rise in the right circumstances.
Currently net short 108.9k, up 6.3k.