Following futures positions of non-commercials are as of January 10, 2017.
10-year note: This is what makes a market. Two different bond luminaries looking at the same asset and coming up with two different analyses/conclusions.
The issue in question is 10-year T-yields, which since the all-time low of 1.34 percent on July 6 last year rallied all the way to 2.62 percent on December 15. It was up 80 basis points post-U.S. presidential election alone.
Despite the backup in yields since the July low, the 10-year remains trapped within a three-decade declining channel. Hence the all-important question, at what point would the bull market end?
Bill Gross, of Janus Capital, has his eyes set on 2.6 percent. He believes if yields rally above that threshold, that would spell the end of the bull market.
Jeffrey Gundlach, of DoubleLine Capital, says yields would have to take out three percent before the bull ends.
As noted above, yields began to come under pressure after hitting 2.62 percent mid-December. Hence its significance. But three percent, or thereabouts, is what will push the 10-year out of the afore-mentioned channel. Should it happen, this will represent a major breakout.
Non-commercials, who have built the most net shorts ever in 10-year note futures, probably anticipate one. Which also means, should these traders are forced to reverse, this has the potential to unleash downward pressure on yields.
From the mid-December high through Thursday’s low, yields dropped 31 basis points, and are currently testing the 50-day moving average. This is a good place for bond bears to put their foot down.
Currently net short 394.7k, up 49.8k.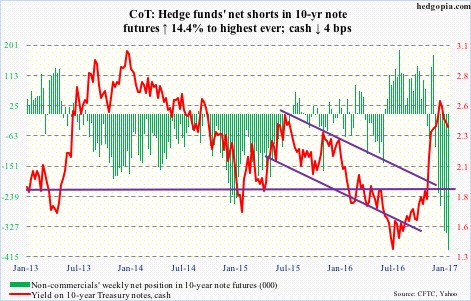
30-year bond: Major economic releases next week are as follows.
Markets are closed on Monday for observance of Martin Luther King Jr. Day.
Wednesday’s busy schedule includes CPI (December), industrial production (December), NAHB housing market index (January), and Treasury International Capital (November).
Both the consumer price index and core CPI rose 0.2 percent month-over-month in November. In the 12 months through November, they respectively advanced 1.7 percent and 2.1 percent. This was 13 straight months of core CPI north of two percent year-over-year.
Industrial production fell 0.4 percent m/m in November and 0.6 percent y/y. This was the 15th consecutive y/y drop. Similarly, capacity utilization fell 21 months in a row m/m. Having peaked at 78.9 percent in November 2014, utilization fell to a cycle low 75 percent in November.
Builder sentiment jumped seven points m/m in December to 70, matching the July 2005 high.
Foreigners purchased $20.5 billion in U.S. equities in October, bringing the total in the past four months to $46.1 billion. On a 12-month rolling total basis, they net-sold $21.7 billion. On that basis, net sales peaked in February last year at -$138.9 billion.
Thursday brings housing starts (December). Starts collapsed 18.7 percent m/m in November to a seasonally adjusted annual rate of 1.09 million units. They surged 27.4 percent m/m in October to 1.34 million units, which were the highest since July 2007.
Currently net short 43.8k, up 11.6k.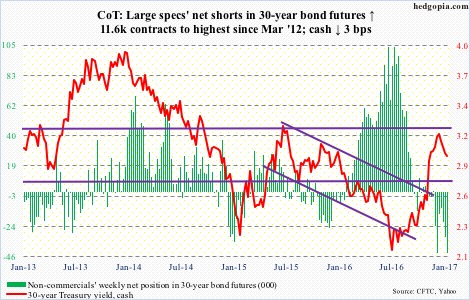
Crude oil: The latest EIA report released Wednesday was full of negatives, yet spot West Texas Intermediate crude rallied 2.8 percent in that session. This is likely because (1) the US dollar index fell slightly in that session, and (2) Saudi Arabia told some of its Asian customers that it would be cutting crude supplies slightly in February. Plus, the WTI had opened the week down 3.8 percent on Monday. That drop pushed it below support at $52, which it reclaimed on Wednesday.
This week’s action was preceded by five straight weekly dojis. The path of least resistance medium term remains down. A rising trend line drawn from the February lows (2016) converges around $47-$48.
In the meantime, for the week of January 6, U.S. crude stocks increased by 4.1 million barrels to 483.1 million barrels. Stocks of gasoline and distillates rose by five million barrels and 8.4 million barrels to 240.5 million barrels and 170 million barrels, respectively. Distillates were the highest since October 2012, and gasoline since July last year.
Crude imports rose, too – by 1.9 million barrels per day to 9.1 mbpd – the highest since September 2012. Crude production grew by 176,000 bpd to 8.9 mbpd; this was the highest since April last year.
On a positive note, refinery utilization rose by 1.6 percentage points to a four-month high 93.6.
Currently net long 449.9k, up 18.9k.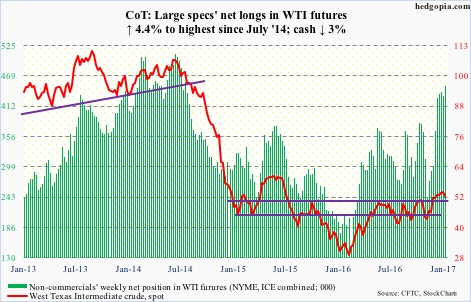
E-mini S&P 500: From November 9 through this Wednesday, $18.6 billion moved into SPY, the SPDR S&P 500 ETF. That is after accounting for the $4.5 billion in withdrawals in the week ended this Wednesday. This week’s redemptions more than took care of the $3.7 billion in inflows in the prior two (courtesy of ETF.com).
The cash is up 6.3 percent post-election, but has done nothing for five weeks now. Thursday – as well as the week – produced a dragonfly doji. This can potentially be a sign that the bulls are struggling to maintain the uptrend.
At this juncture, outflows do not help. That said, in the week ended Wednesday, $2.4 billion moved into U.S.-based equity funds – $22.9 billion post-election (courtesy of Lipper).
The longer the sideways action in the cash continues – let alone decline – the higher the odds this money grows restless.
Currently net long 21.4k, down 60k.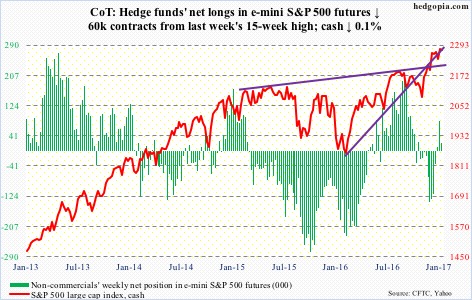
Euro: Eurozone industrial output in November came in stronger than expected – up 1.5 percent m/m and 3.2 percent y/y.
The currency rose one percent in the week. This was a fourth consecutive up week.
Last week, it closed right on support at 105-plus. Intra-day drops below that support were bought this week. Post-industrial output news on Thursday, the currency even went after the 50-day moving average – unsuccessfully – followed by a long-legged doji on Friday right on that average. It is beginning to look extended on the daily chart, so a breather is due.
Currently net short 65.8k, down 4.2k.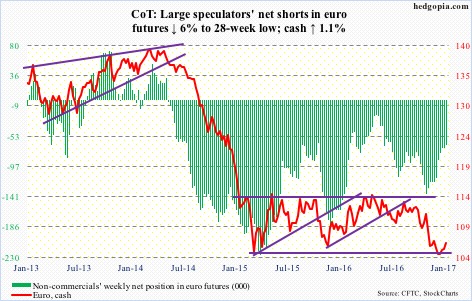
Gold: The good: the cash continues to show nice price action. It took out the 50-day moving average ($1,190.87/ounce), and has been rallying along the rising daily upper Bollinger band. The bad: three straight up weeks have been unable to stop the outflows.
In the week ended Wednesday, GLD, the SPDR gold ETF, lost another $325 million – $721 million in the past three. This was the ninth straight weekly loss, totaling $5.7 billion in outflows (courtesy of ETF.com).
The metal ($1196.2) looks a little extended on the daily chart – but not so on the weekly. There is resistance at $1,200.
Currently net long 109.5k, up 12.9k.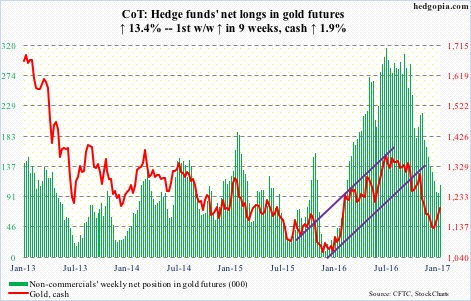
Nasdaq 100 index (mini): Through Wednesday, the cash logged seven straight sessions of gains. Year-to-date, it is up four percent, and has not only recaptured 4900, but has managed to also carve out near-term support at 4960.
Flows cooperated. In the week ended Wednesday, QQQ, the PowerShares Nasdaq 100 ETF, pulled in $642 million (courtesy of ETF.com).
Interestingly, shorts probably sensed an impending rally, thus covered in the December 16-30 period. QQQ short interest dropped 16.3 percent to 41.2 million shares. Also, Nasdaq short interest dropped 1.5 percent even as the composite fell 1.4 percent. Nasdaq short interest is now at the lowest since the end of January 2014. Since the middle of February last year, short interest fell nearly 15 percent, which provided a major boost to the index. That tailwind is less potent now.
Currently net long 81.7k, up 8k.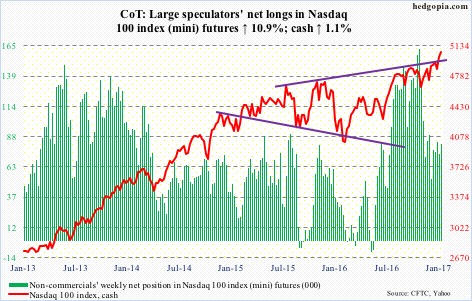
Russell 2000 mini-index: Since the cash peaked on December 9 at 1392.71, it had been making lower highs, with support at 1350-plus. Come Thursday, that support was lost intra-day, but recaptured by close. Bulls stepped up to defend month-and-a-half support at 1347.
Small-caps have had a massive rally particularly post-election, and have tons of unwinding left in the right circumstances.
Non-commercials, who are heavily net long, are vulnerable. The cash has essentially gone sideways for five weeks now. If and when their patience breaks and decide to unload their holdings, bears will lick their chops.
In the meantime, in the week ended Wednesday, $60 million left IWM, the iShares Russell 2000 ETF. In the prior four weeks, it took in $1.7 billion (courtesy of ETF.com).
Currently net long 82.4k, down 10.2k.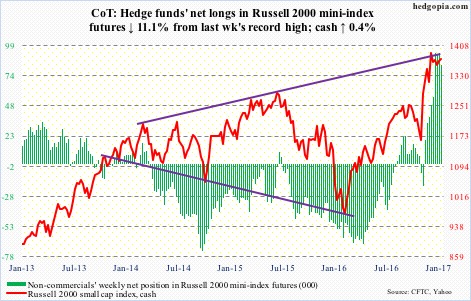
US Dollar Index: On Wednesday, when President-elect Donald Trump held his first post-win press conference, the cash had a wild session, ranging from 101.24 to 102.96 before closing on 101.75. Shorter-term moving averages had already been lost.
The 50-day moving average (101.11) was tested on Thursday and Friday. This area also approximates the highs of 100.71 and 100.60 of March and November 2015, which the dollar index broke out of last November. So the average likely holds near-term.
That said, there are tons of weekly overbought conditions remaining to be unwound.
Currently net long 53.1k, down 1.1k.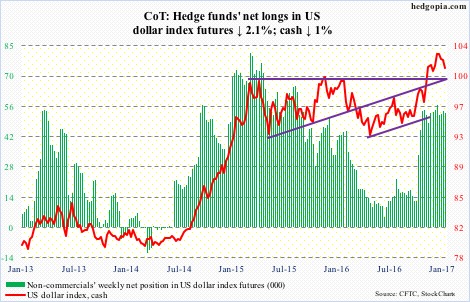
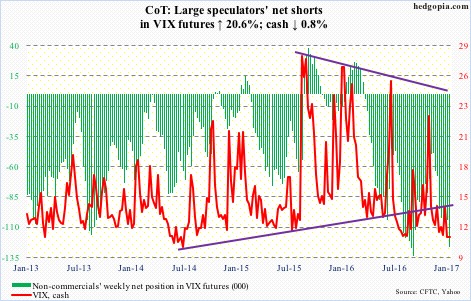
VIX: On the cash, 10- and 20-day moving averages have converged. In three of the first four sessions this week, they resisted rally attempts, with VIX closing below 12 in all four. On Friday, it dipped below 11 intra-day. This week’s action followed unsuccessful attempts last week to take out both 50- and 200-day, which are two to three points higher.
The VIX-to-VXV ratio has now been in the high .70s in six of the last eight weeks, with the other two in the mid-.80s. The rubber band is stretched.
Currently net short 126.2k, up 21.6k.