Following futures positions of non-commercials are as of January 17, 2017.
10-year note: Bond bears near term have as good a chance as any to push long bonds still lower. TLT, the iShares 20+year Treasury bond ETF, peaked this Tuesday, and is down 2.4 percent, losing the freshly-reclaimed 50-day moving average in the process. In the meantime, 10-year yields rose from 2.31 percent to 2.47 percent. They peaked at 2.62 percent on December 15.
Yields are currently unwinding their daily oversold conditions. On a weekly basis, though, they remain overbought.
It will be interesting to see if non-commercials will try to take advantage of the recent uptick in rates and cut back on their record net shorts in 10-year-note futures. They did cut back some this week. These massive holdings remain a potential source of rates headwind in the future.
Currently net short 375.7k, down 19k.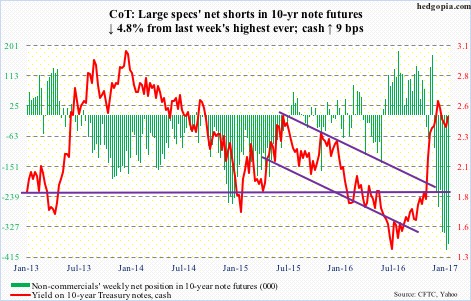
30-year bond: Major economic releases next week are as follows.
Existing home sales for December are due out on Tuesday. November rose 0.7 percent month-over-month to a seasonally adjusted annual rate of 5.61 million units – the highest since February 2007.
Thursday brings new home sales for December. November was up 5.2 percent m/m to 592,000 units (SAAR). July last year saw a high of 622,000, which was the highest since January 2008.
Durable goods (December, advance), GDP (4Q16, advance estimate), and the University of Michigan’s consumer sentiment (January, final) come out on Friday.
Orders for non-defense capital goods ex-aircraft – proxy for business capital expenditures – rose a percent m/m in November to $63.6 billion (SAAR), and fell 2.8 percent year-over-year. This was the 13th straight y/y contraction. Orders peaked at $70.7 billion in September 2014.
Real GDP advanced 3.5 percent in 3Q16. This was the highest growth rate since surging five percent eight quarters ago. The Atlanta Fed’s GDPNow model forecasts growth of 2.8 percent in 4Q16.
January’s preliminary estimate showed consumer sentiment inched down one-tenth of a point m/m to 98.1. December’s 98.2 was the highest since 103.8 in January 2004.
Currently net short 22.7k, down 21k.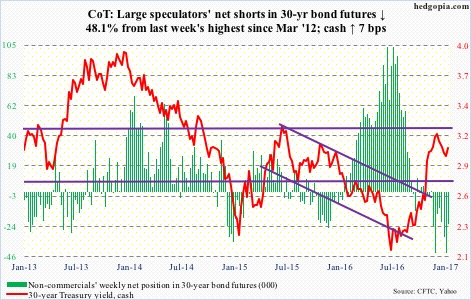
Crude oil: For the sixth straight week, oil bulls have now been rejected at $54-plus on spot West Texas Intermediate crude. This week produced another doji – 6th in last seven weeks. Thus far, $52 has been defended, but it is probably only a matter of time before this gives way.
The crude has essentially gone sideways since December, even as non-commercials’ net longs in WTI futures went up 62 percent – now highest since July 2014. This raises the risk that these traders lose patience at some point – particularly if $52 is lost.
A rising trend line drawn from the February lows (2016) converges around $47-$48.
The latest EIA report was mixed at best.
For the week of January 13, crude stocks went up by 2.3 million barrels to 485.5 million barrels. Gasoline stocks rose by six million barrels to 246.4 million barrels – the highest since March last year. And, refinery utilization fell by 2.9 percentage points to 90.7; the prior week was a four-month high.
Distillate stocks dropped by 968,000 barrels to 169.1 million barrels; the prior week was the highest since October 2012. Crude imports fell by 674,000 barrels/day to 8.4 million b/d. Similarly, crude production inched down 2,000 b/d to 8.9 mb/d; the prior week was the highest since April last year.
Currently net long 487.7k, up 37.8k.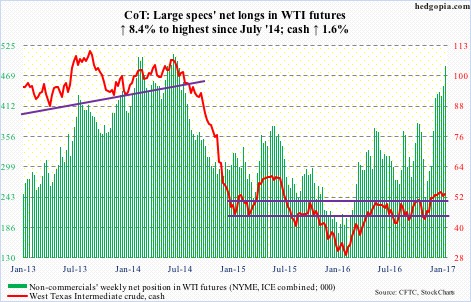
E-mini S&P 500: SPY, the SPDR S&P 500 ETF, lost another $2.3 billion in the week through Wednesday. This comes on the heels of outflows of $4.5 billion in the prior week (courtesy of ETF.com).
The cash has gone sideways for five weeks, with a weekly doji this week plus a back-to-back inside week. This was preceded by a quick 6.6-percent rally post-November 8 election.
In essence, the S&P 50 could just be consolidating before another leg higher or is just tired. It is probably the latter.
Outflows at this juncture do not help. This can feed on itself. From November 9 through this Wednesday, $16.2 billion moved into SPY. There is decent amount of money waiting to lock in post-election gains.
Also in the week ended Wednesday, $3.1 billion left U.S.-based equity funds. This followed inflows of $16.6 billion in the prior three (courtesy of Lipper).
Currently net long 35.3k, up 13.9k.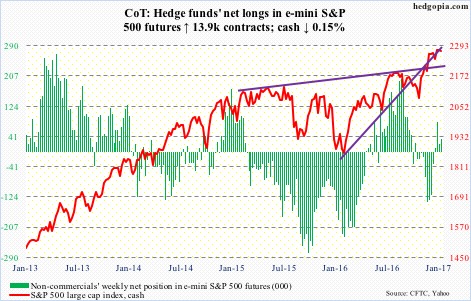
Euro: Eurozone consumer prices were up 0.5 percent higher m/m in December, and up 1.1 percent y/y. Core inflation only edged up 0.9 percent y/y. Readings were stronger than expected. Inflation has perked up of late, but is still below the ECB’s goal of just below two percent.
From January 3 intra-day low of 103.41 through Tuesday’s high of 107.18, the euro (107.02) rallied 3.6 percent in 10 sessions, and is probably looking for a reason to pause. Daily conditions are overbought, and there is gap-down resistance at just under 108.
Bulls need to defend support at 105-plus, which coincides with the 20-day moving average.
Currently net short 66.5k, up 677.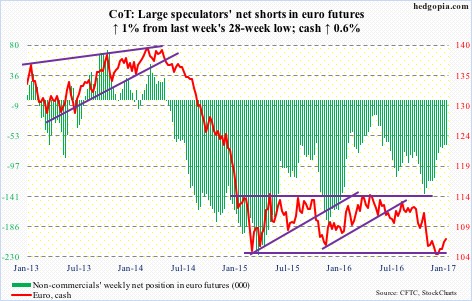
Gold: At long last some inflows. After nine consecutive weeks of outflows totaling $5.7 billion, GLD, the SPDR gold ETF, attracted $115 million in the week ended Wednesday (courtesy of ETF.com).
Too little, too late?
From December 15 through January 17, the cash rallied 8.4 percent, rallying past several important averages. Leading up to and throughout all this, the ETF bled.
Now, daily technicals are in overbought territory, with the metal ($1,204.9/ounce) acting as if it wants to head lower.
Gold bugs need to defend $1,185, which also approximates the 50-day moving average.
Currently net long 107k, down 2.4k.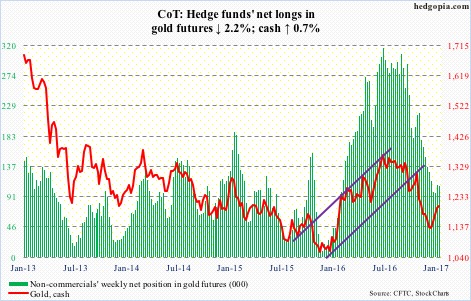
Nasdaq 100 index (mini): Year-to-date on a relative basis, tech has done much better, with the Nasdaq 100 up 4.1 percent, versus the S&P 500 up 1.5 percent and the Russell 2000 down 0.4 percent. This is also reflected in flows.
Through Wednesday, QQQ, the PowerShares Nasdaq 100 ETF, took in $160 million, versus outflows of $4.8 billion for SPY and $269 million for IWM, the iShares Russell 2000 ETF (courtesy of ETF.com).
In the latest week, QQQ attracted $245 million, preceded by $642 million in inflows in the prior week.
Some signs of fatigue are beginning to show up on the cash’s daily chart. Bears first need to be able to take out shorter-term moving averages, which are still rising. Bulls in the meantime have forged decent support at 4990, and then 4900.
Currently net long 89k, up 7.3k.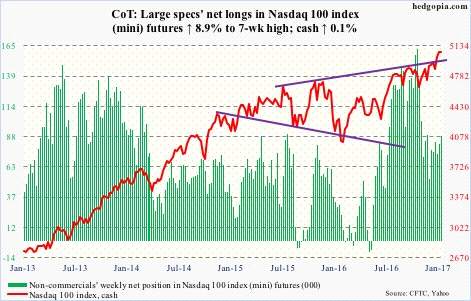
Russell 2000 mini-index: No sooner than the 10- and 20-day moving averages were reclaimed (Friday last week) than they were lost again. The cash opened the week down 1.4 percent, and by Thursday proceeded to test the 50-day moving average, which held. For now.
One can argue the Russell 2000 has been correcting through time, rather than price. It has essentially gone sideways for the last six weeks.
Here is another way to look at this. When the index peaked on December 9 at 1392.71, the 50-day moving average lied at 1260, now it is at 1343.
Looking at recent trend in flows, it is probably only a matter of time before the 50-day is lost. In the week ended Wednesday, IWM lost $331 million, following outflows of $60 million in the prior week. In the prior four weeks, it took in $1.7 billion.
Non-commercials’ sizable net longs remain the biggest wildcard. Having caught the post-election rally spot-on, they must be very tempted to lock in profit. Net longs did go down this week.
Currently net long 67.4k, down 15k.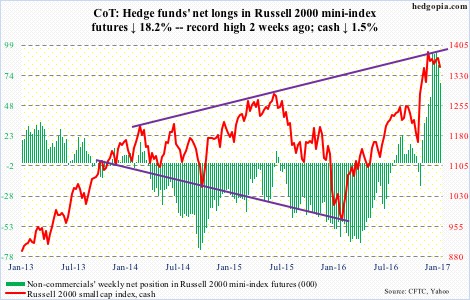
US Dollar Index: History was made this week. Sort of. The cash dropped 0.9 percent on Tuesday responding to President-elect Donald Trump’s statement he made to the Wall Street Journal on Friday last week that the strong dollar was killing U.S. companies’ ability to compete.
Dollar bulls were already struggling to save last November’s breakout. The president-elect’s comments did not help. On Tuesday, the dollar index sliced through its 50-day moving average, and an attempt to reclaim the average in the following threee sessions failed.
That said, the cash is oversold on a daily basis. The area of interest remains 102. Inability to rally past this support-turned-resistance increases the odds that overbought weekly conditions continue to get unwound.
A rising trend line drawn from the May 2016 low gets tested around 98.
Currently net long 49.1k, down 4k.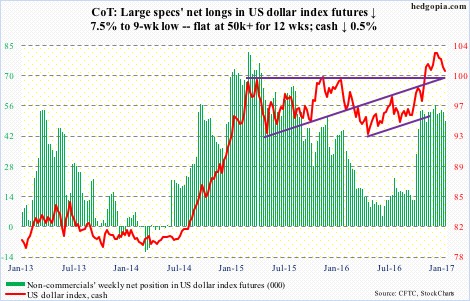
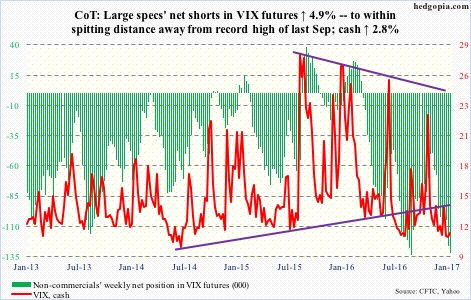
VIX: On the cash, the 50-day moving average, which resisted a rally attempt on Thursday, is rapidly dropping. Here is the thing, though. With the average at 12.68, and solid support in the 11-12 range on the cash, how long before that average gets convincingly taken out? It probably happens soon.
The VIX-to-VXV ratio, by the way, after remaining stuck in the high .70s in six of the prior eight weeks, inched up to .8 this week. There is a long way to go before the ratio gets overbought.
Amidst this, non-commercials are net short VIX futures up to the gills – a hair’s breadth away from the record high last September. Unwinding of these will not be pretty.
Currently net short 132.4k, up 6.2k.