Following futures positions of non-commercials are as of January 31, 2017.
10-year note: During his presidential campaign, President Donald Trump openly criticized the Fed’s easy monetary policy. Indeed, since June 2006, there have only been two 25-basis-point increases in the fed funds rate – one in December last year and the other a year before that.
This week, the Fed left rates unchanged, to a range of 0.5 percent to 0.75 percent. When it hiked in December, the dot plot suggested there might be three hikes this year. Since then, there has been visible improvement in U.S. economic data. Yet, the Fed did not signal that March was even in play.
What might be bugging the Fed? Better yet, what might be bugging the Fed this time around?
The U.S. dollar index rallied nearly 26 percent in nine months through March 2015. Range-bound since, it rallied 13 percent from the lows of last May through the high early this year. The Trump administration is not happy about this. Mr. Trump himself as well as Treasury Secretary-nominee Steven Mnuchin have already voiced their concerns.
The Fed is listening.
Currently net short 353.7k, up 56.5k.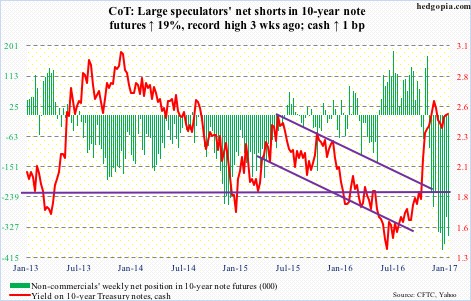
30-year bond: Major economic releases next week are as follows.
Tuesday brings the National Federation of Independent Business optimism index (January) and JOLTS (December).
Small-business optimism surged 10.9 points in November and December. This was the largest two-month jump in the series’ history (data goes back to January 1986).
Non-farm job openings increased 71,000 month-over-month in November to 5.52 million. Openings peaked at 5.85 million last April – essentially flat with 5.79 million in July 2015 and 5.83 million last July.
The University of Michigan’s consumer sentiment index for February (preliminary) comes out on Friday. Consumer sentiment shot up 6.6 points m/m in November and then another 4.4 points in December to 98.2. This was the highest monthly reading since 103.8 in January 2004. The two-month, 11-point jump was the largest since January 2012 when sentiment jumped 11.3 points over a couple of months.
Currently net short 36.3k, up 2.6k.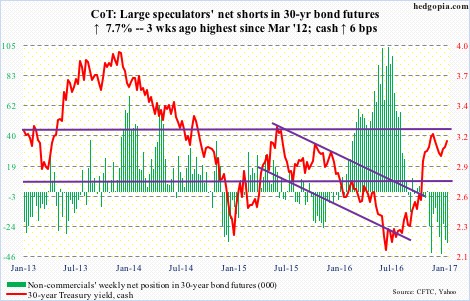
Crude oil: Yet another week in which bulls were unable to take out resistance at $54-plus but defended support at $52-plus.
This week was preceded by seven weekly doji out of eight, with spot West Texas Intermediate crude sideways the past eight weeks. This, of course, followed a massive rally off the lows of last February during which oil more than doubled.
On the daily chart, Bollinger bands are tightening. A big move is likely. The path of least resistance remains down – particularly considering inventory continues to be an issue.
For the week of January 27, U.S. stocks rose across the board.
Crude inventory was up 6.5 million barrels to 494.8 million barrels – a 22-week high. Gasoline stocks rose 3.9 million barrels to 257.1 million barrels, which was the highest since last February. Distillate stocks increased 1.6 million barrels to 170.7 million barrels – the highest since October 2010.
Similarly, crude imports rose 480,000 barrels per day to 8.3 million b/d.
Refinery utilization inched down one-tenth of a point to 88.2 percent. This is down from 93.6 three weeks ago, which was a four-month high.
Crude production dropped a tad, down 46,000 b/d to 8.9 mb/d. Last week’s total was the highest since April last year.
Even as spot WTI is showing signs of indecision/fatigue, non-commercials now hold record net longs. Beware the unwinding – timing notwithstanding!
Currently net long 522.9k, up 15.6k.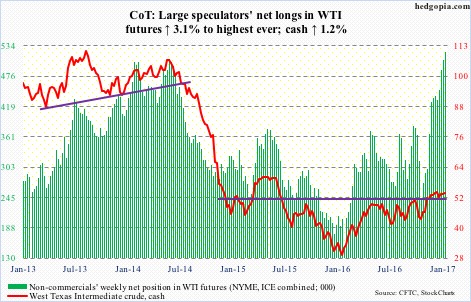
E-mini S&P 500: On January 26, the cash scored an all-time high of 2300.99, before coming under slight pressure. Since that session through this Wednesday, SPY, the SPDR S&P 500 ETF, took in $3.9 billion, following three-week outflows of $8.8 billion (courtesy of ETF.com). The ETF inched up 0.1 percent in the week.
Similarly, also in the week through Wednesday, Lipper data show $13.8 billion moved into U.S.-based equity funds. Once again, bulls were not able to fully take advantage of this. They did defend breakout retest, though, with an up January.
The S&P 500 went sideways from December 13, with a rather meek breakout on January 25. Weekly indicators look to head lower, but they have to first wrest control of shorter-term daily moving averages that are once again rising.
Currently net long 70.8k, down 2.1k.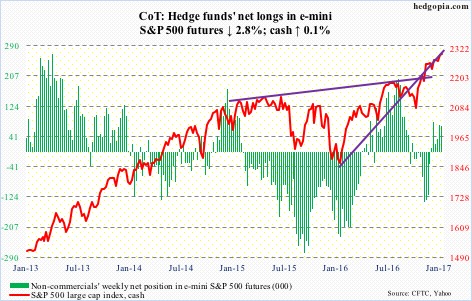
Euro: As soon as the week started, the cash found support at its rising 20-day moving average, then rallying to 108.29 by Thursday. This essentially filled the gap of November 14 last year.
The daily chart is extended, and this likely is as good a spot as any to pause/reverse. In the event the currency (107.85) comes under pressure near term, there is plenty of support underneath. The 50-day moving average, now slightly rising, rests at 106.04, followed by 105-plus horizontal support.
Currently net short 45.7k, down 6.6k.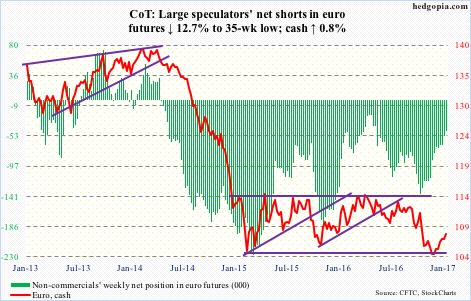
Gold: On Friday last week, gold bugs defended the 50-day moving average on the cash. This also approximated support at $1,185/ounce. So far so good. On the weekly chart, the cash has room to rally, with a fresh bullish MACD crossover.
The 200-day lies at $1,266.66. For the cash to rally that far near term, flows need to improve.
In the week ended Wednesday, GLD, the SPDR gold ETF, attracted $416 million. This was the second week of inflows in the past 12, during which the ETF lost $5.6 billion (courtesy of ETF.com).
Currently net long 119.2k, up 9.7k.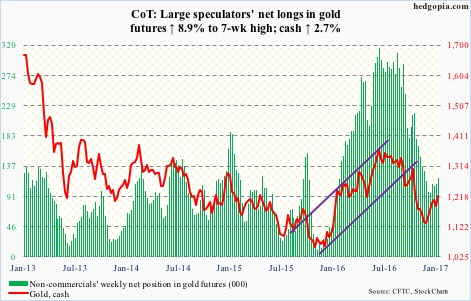
Nasdaq 100 index (mini): Thursday, Facebook (FB) had a massive reversal candle. Apple (AAPL), too, had a reversal-like candle one day earlier. Alphabet (GOOG) had one on January 27. In that same session, Microsoft (MSFT) broke out to an all-time high, followed by four-plus percent drop in the next four. Amazon (AMZN) is bumping against – and unable to clear out – resistance from October 6 last year.
The point is, the Nasdaq 100 is a market cap-weighted index, and leading names are showing signs of fatigue.
On the index itself, buyers are showing up near shorter-term moving averages, which are still pointing up. They need to roll over for bears to get traction.
Flows have been off and on. In the week ended Wednesday, QQQ, the PowerShares Nasdaq 100 ETF, attracted $1.5 billion (courtesy of ETF.com). This was preceded by outflows of $2.1 billion in the prior week, and inflows of $887 million in two weeks before that.
Currently net long 99.7k, up 12k.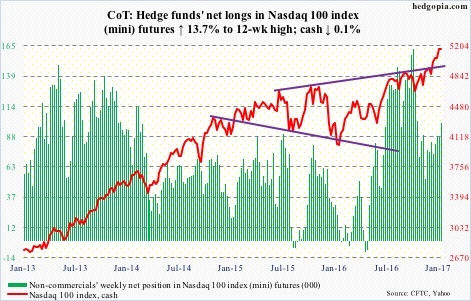
Russell 2000 mini-index: Another lower high for the cash. The good thing, from bulls’ perspective, is that the 1340 level continues to draw buyers.
Here is the rub.
The index has gone sideways for eight weeks now. The 50-day moving average has caught up with it, and is now going flat. That said, bulls refuse to easily give up the average, which they reclaimed on Friday. Ditto with 10- and 20-day.
In the week ended Wednesday, IWM, the iShares Russell 2000 ETF, saw inflows of $757 million. In the prior three, $1.8 billion was withdrawn (courtesy of ETF.com).
In the meantime, non-commercials reduced net longs 43 percent from a record high four weeks ago, without much adverse impact on the cash – thus far.
Currently net long 53.2k, down 22.3k.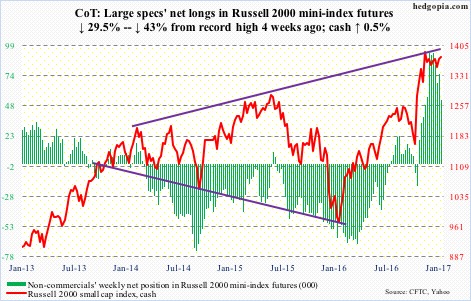
US Dollar Index: Dollar bulls were unable to defend post-election breakout of last November, but did manage to save support at a lower level.
The cash bottomed last May at 91.88, then peaking at 103.82 on January 3 this year. A 38.2-percent retracement of that move puts it at 99.26. Thursday, it dropped to 99.20 before bids showed up. This area also held three-month horizontal support.
Can they build on this?
The daily chart is oversold, with a long-legged doji on Friday.
The 50-day moving average – now slightly dropping – rests at 101.43. Before that lies horizontal resistance dating back to March 2015, when the index peaked at 100.71. This resistance was broken last November, but is now lost.
Worse – not very likely near term – it drops to around 98, which is where a rising trend line drawn from the afore-mentioned May 2016 low meets. This is a must-save.
Currently net long 46.6k, down 1.9k.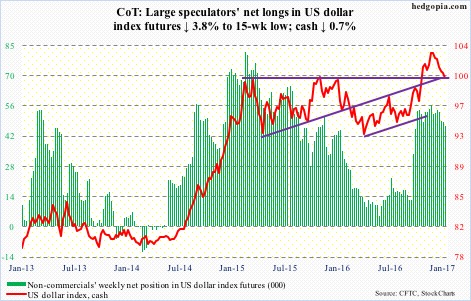
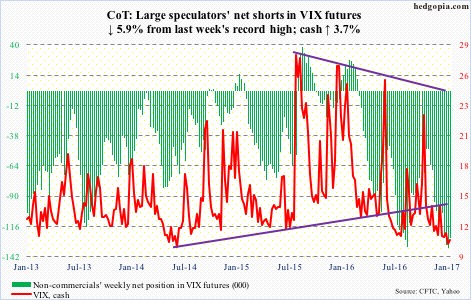
VIX: On Wednesday, the cash dropped intra-day to 9.97 – the lowest since February 2007. Back then, VIX had sub-10 lows for four straight months – November 2006 through February 2007.
The Wednesday session also produced a dragonfly doji, which more often than not signals the direction of the trend could be reversing. Thus far, the trend is down. A reversal, should it occur, will be on the upside.
Currently, the cash is locking horns with the 50-day moving average, which is now flattish. Once it starts rising, volatility will have legs.
Non-commercials have amassed massive net shorts in VIX futures. Unwinding of these – a matter of when not if – will only help volatility bulls.
Also on Wednesday, the VIX-to-VXV ratio dropped intra-day to .71, although by Friday it rose to .78. This preceded four straight weeks in which the ratio lingered in the .70s – and in eight out of last 10 weeks. This is another unwinding candidate.
Currently net short 126.3k, down 7.9k.