
Following futures positions of non-commercials are as of March 21, 2017.
10-year note: Currently net short 100.4k, down 94k.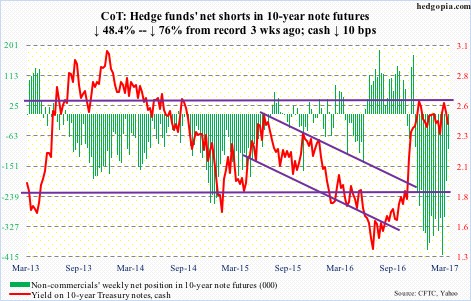
In a Tuesday speech this week, Loretta Mester, president of the Cleveland Fed, said this: “If economic conditions evolve as I anticipate, I would be comfortable changing our reinvestment policy this year.”
As a by-product of three iterations of quantitative easing, the Fed boasts a $4.5-trillion-strong balance sheet, and reinvests the proceeds of maturing Treasury securities and principal payments from agency debt and agency mortgage-backed securities.
Ms. Mester would like to begin to shrink the bloated balance sheet.
We have come a long way. Early this month, markets were putting the odds of a hike this month at 30-plus percent. Then began the Fed’s jawboning. Markets quickly rerated. The Fed hiked. Now Ms. Mester – later joined by Robert Kaplan, Dallas Fed president, and James Bullard, St. Louis Fed president – has floated the idea of balance-sheet contraction. For real?
There is one potential problem. The U.S. economy is hardly booming.
Real GDP grew at a seasonally adjusted annual rate of 1.9 percent in 4Q16. The Atlanta Fed’s GDPNow model forecasts 1Q17 growth of one percent! The ISM manufacturing index stood at 57.7 in February – up 8.3 points in the past six months and at a six-month high. Odds favor it peaks soon, if it has not already.
This should limit the Fed’s urge – should it get one – to double-tighten: rise in interest rates coupled with contraction of the balance sheet. Especially when the yield curve is not steepening.
30-year bond: Currently net short 54k, down 8.2k.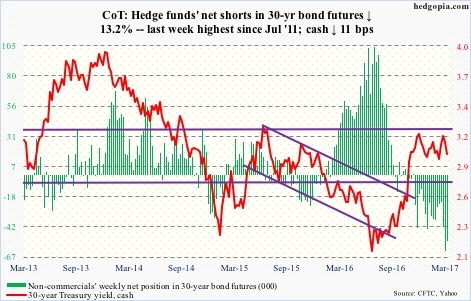
Major economic releases next week are as follows.
January’s S&P Corelogic Case-Shiller housing price index is published on Tuesday. Nationally, prices were up 5.9 percent year-over-year in December – the highest since June 2014, and far exceeding consumer inflation (below).
The pending home sales index for February comes out on Wednesday. January was down 3.1 points month-over-month to 106.4 – a one-year low.
Thursday brings GDP (4Q16, third estimate) and corporate profits (4Q16).
The second estimate showed real GDP grew at a seasonally adjusted annual rate of 1.9 percent in 4Q16 – slower than the post-Great Recession average of 2.1 percent, and much slower than the average 3.2 percent going back to 2Q47.
Corporate profits rose 2.1 percent y/y in 3Q16 to $2.14 trillion (SAAR) – the first up quarter after five down in a row. Profits peaked at $2.22 trillion in 4Q14.
Personal income (February) and the University of Michigan’s consumer sentiment index (March, final) are on tap for Friday.
Core personal consumption expenditures (PCE) – the Fed’s favorite measure of consumer inflation – increased 1.74 percent y/y in January. This was the highest since 1.77 percent in July 2014. Inflation has been inching up since 1.31 percent in July 2015. That said, the last time it rose north of two percent was in April 2012.
Preliminarily, consumer sentiment rose 1.3 points m/m in March. January’s 98.5 was a 13-year high.
Crude oil: Currently net long 435k, down 22k.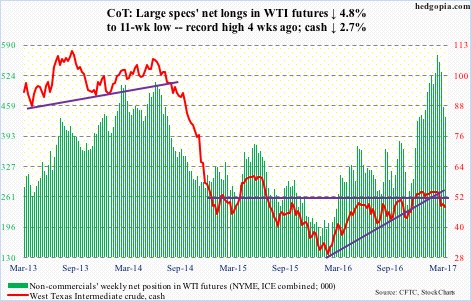
In the week ended March 17, U.S. crude stocks increased 5 million barrels to 533.1 million barrels – yet another record.
Gasoline and distillate stocks in the meantime continued to drop. The former fell 2.8 million barrels to 243.5 million barrels and the latter 1.9 million barrels to 155.4 million barrels. In the last five weeks, gasoline inventory declined 15.6 million barrels, and in the last six distillates 15.4 million barrels.
Traders were probably confused if they should react to crude or gasoline/distillates. And it showed up on the daily chart.
On Wednesday, spot West Texas Intermediate crude declined 2.5 percent intraday, but recovered to close down 0.4 percent. In that hammer session, bulls defended support from six sessions ago – $47 has now taken on importance. Even if it is not violated, the crude needs time to stabilize.
Worse, it drops to $42-$43. Since OPEC reached its cutback agreement late November last year, U.S. crude production has gone up by north of 400,000 barrels per day.
In the latest week, production inched up 20,000 b/d to 9.13 million b/d – a 13-month high. Crude imports were up 902,000 b/d to 8.3 mb/d – a five-week high.
In the meantime, refinery utilization expanded 2.3 percentage points to 87.4 percent – a six-week high.
E-mini S&P 500: Currently net long 89.1k, down 72.7k.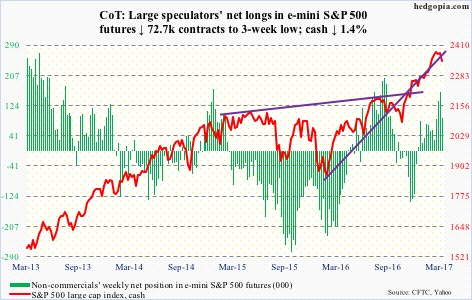
Things have not been going well for the cash since it gapped up on March 1 to an intraday all-time high of 2400.98. Of note is Tuesday’s high-volume, 1.2-percent drop, which sliced through the 10- and 20-day moving averages. Since that peak, there are now lower highs and lower lows.
That said, the index Friday came within 0.2 percent of testing the 50-day, which has not been tested post-election, so likely does not give way at the very first try. One possibility is it rallies to 2370, which approximates a declining trend line from the March 1 peak. Flows will probably decide what happens from there.
In the week ended Wednesday, SPY, the SPDR S&P 500 ETF, lost $3.3 billion. In the prior three, it took in $9.6 billion (courtesy of ETF.com).
In the same week, $1 billion came out of U.S.-based equity funds. This was the first withdrawal in the last eight weeks, with $47.1 billion moving in the prior seven (courtesy of Lipper).
For the week, the S&P 500 lost 1.4 percent.
Euro: Currently net short 19.7k, down 21.4k.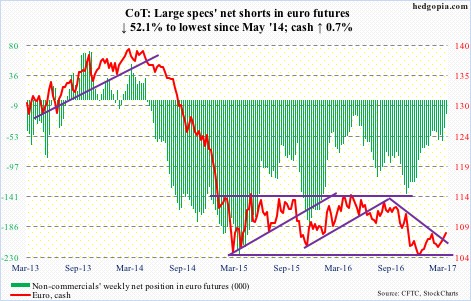
Picture-perfect test of resistance.
On Wednesday, the cash rallied intraday to 108.26 before getting repelled. An attempt to take out resistance at 108-plus was also rejected on February 2, when it hit 108.29. This is where the neckline of a potential inverse head-and-shoulders rests.
Bulls did a great job this month of rallying the currency this far, but are also showing signs of fatigue. On the daily chart, two of the past four sessions produced a doji. Support at the rising 50-day moving average is 1.2 percent away.
Should it manage to rally, a declining trend line from May last year gets tested around 109.
Gold: Currently net long 116.3k, up 10.2k.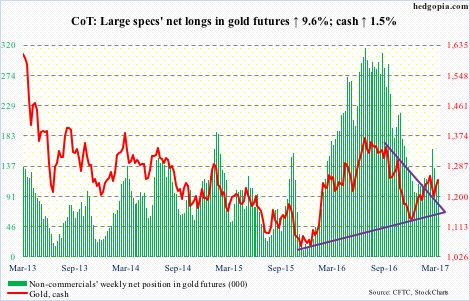
In February, gold bugs had difficulty taking out and then staying above $1,240-ish on the cash. In fact, the metal rallied all the way to $1,264.9 on February 27 before getting repelled by the 200-day moving average. In the last four sessions this week, gold pretty much sat on $1,340-plus.
For now, the yellow metal is caught between 50- and 200-day. It is possible it proceeds to test the rising 50-day ($1,224) near term.
Flows continue to alternate between the recent trend of in and out. In the week ended Wednesday, GLD, the SPDR gold ETF, lost $196 million, preceded by inflows of $102 million in the prior week (courtesy of ETF.com).
Nasdaq 100 index (mini): Currently net long 76.1k, up 2k.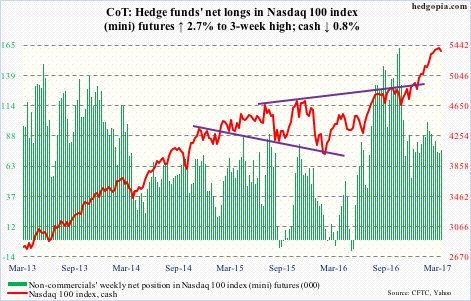
Despite Tuesday’s massively engulfing bearish candle in which the cash lost 1.5 percent, it is yet to develop a cross-under between 10- and 20-day moving averages. Such has been the momentum this year behind the tech- and biotech-laden index.
Of the top five Nasdaq 100 weights, Apple (AAPL), Facebook (FB) and Amazon (AMZN) rose to fresh all-time highs Tuesday before reversing hard, while Microsoft (MSFT) and Alphabet (GOOGL) tested recent record highs.
Too soon to say if bears can develop the Tuesday reversal into something big. This much we know. Year-to-date (through Wednesday), QQQ, the PowerShares Nasdaq 100 ETF, lost $455 million (courtesy of ETF.com), and this did not matter.
Russell 2000 mini-index: Currently net short 42.2k, up 17.5k.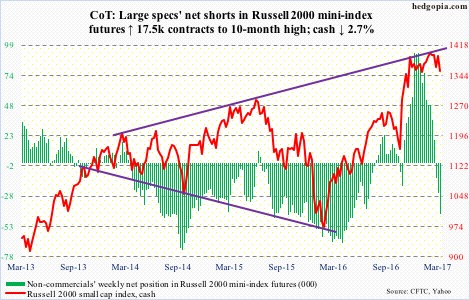
The cash has been bobbing up and down between 1392 and 1347 for three and a half months. Tuesday’s 2.7-percent mini-collapse literally dropped the index at that support, with a slight breach the next day. Friday produced a long-legged doji right on support.
Bulls are stepping up to the plate to defend 1347. In the week ended Wednesday, IWM, the iShares Russell 2000 ETF, took in $2.6 billion (courtesy of ETF.com).
Worth remembering: Mid-March short interest on IWM stood at 108.1 million, down 8.1 percent period-over-period but still up from 93.7 million from mid-January. This can act as a potential source of mini-squeeze.
In this scenario, bulls then have to wrestle with tons of resistance – 1375 (50-day moving average, now slightly dropping), 1380-ish (declining trend line from March 1 record high), and, of course, 1392.
US Dollar Index: Currently net long 46.3k, down 1.5k.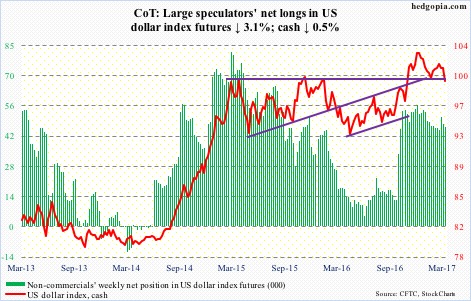
Three back-to-back doji right on support this week. The cash dropped to an intraday low of 99.34 on Wednesday (and 99.36 Friday). This compares with 99.09 on October 25, 99.25 on December 8, and 99.20 on February 2. Hence its significance, and likely holds near term.
Incidentally, this level also represents the neckline of a potentially bearish head-and-shoulders formation.
VIX: Currently net short 113.4k, up 12.9k.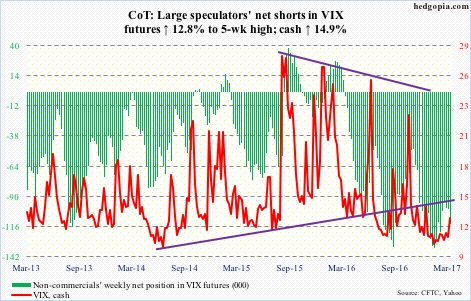
VXX, the iPath S&P 500 VIX short-term futures ETN, is attracting money, having pulled in $257 million in the first three sessions this week. Whether or not they had the right instinct likely depends on if spot VIX is able to take out the 200-day moving average.
Volatility bulls were not able to hang on to Friday’s intraday break out of that average.
The last time VIX closed above that average was November 8 last year, the election day. The average was 15.7 at the time, and rapidly dropping. Now, it is more than two points lower, but flattish to slightly dropping. So odds are better, although it may have to first unwind overbought daily conditions.
