
Following futures positions of non-commercials are as of April 11, 2017.
10-year note: Currently net short 64.5k, up 8.8k.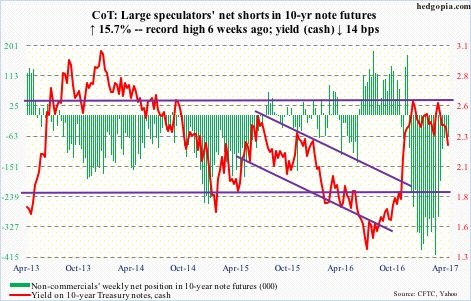
Ten-year Treasury yields (2.23 percent) are breaking down.
Shortly after post-election backup in yields last November, the 10-year began to so sideways between 2.62 percent and 2.31 percent. This week, it lost that support.
The yield curve (spread between two- and 10-year yields) continues to narrow – down from 134 basis points on December 21 last year to 103 basis points.
On the daily chart, 10-year yields are grossly oversold. How things transpire when the broken support-turned resistance gets tested in the days ahead will be telling.
The inability of bond bears to defend range support does not point to an economy ready to accelerate.
March ISM manufacturing index, for instance, inched down five-tenths of a point month-over-month. February’s 57.7 was a 30-month high, with tons of room for weakness ahead – if nothing else just to unwind recent strength.
With this as a background, the Fed has a balancing act to perform. For a month and a half now, it has adopted a decidedly hawkish tone – planning to not only throw in at least a couple more hikes this year but also begin a process of tapering its balance sheet, which has ballooned to $4.5 trillion.
Would they be sounding as hawkish once optimism seen currently in soft data fails to translate into hard data? The answer will have repercussions for a whole host of assets – not the least of which are 10-year yields.
30-year bond: Currently net short 12.9k, down 10.2k.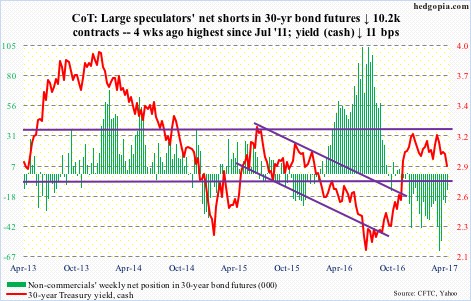
Major economic releases next week are as follows.
Monday brings the NAHB housing market index (April) and the Treasury International Capital (February).
Builder optimism jumped six points m/m in March to 71. This was the highest reading since 72 in June 2005.
On a 12-month running total basis, foreigners’ net purchases of U.S. equities totaled minus $108 million. This has progressively improved since reaching minus $138.9 billion – a record – in February last year. U.S. stocks staged a major bottom back then.
Housing starts (March) and industrial production (March) are due out on Tuesday.
Starts rose three percent m/m in March to a seasonally adjusted annual rate of 1.29 million units. Last October’s 1.32 million units were the highest since 1.33 million units in August 2007.
Capacity utilization inched down 0.3 percent year-over-year in February to 75.4 percent. Over the past 24 months, last December was the only month utilization rose y/y. It peaked at 78.9 percent in November 2014.
Existing home sales for March are published on Friday. Sales fell 3.7 percent m/m to 5.48 million units (SAAR). January’s 5.69 million units were the highest since 5.79 million units in February 2007.
Crude oil: Currently net long 457k, up 36k.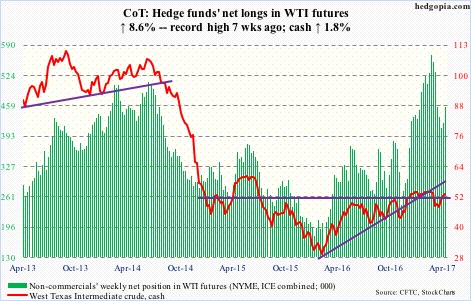
For a change, U.S. crude stocks fell in the week ended April 7 – down 2.2 million barrels to 533.4 million barrels. The prior week was a record. Year-to-date (over 14 weeks), last week’s drop was only the second week-over-week drop. Inventory has been relentlessly rising.
On the other hand, gasoline and distillate stocks continued to drop – down three million barrels and 2.2 million barrels to 236.1 million barrels and 150.2 million barrels, respectively. Over the last eight weeks, gasoline inventory is down 22.9 million barrels, and distillates over the last nine down 20.5 million barrels.
Refinery utilization inched up two-tenths of a point to 91 percent – a 13-week high.
Crude imports rose 28,000 barrels per day to 7.9 million b/d. Production continued higher – up 36,000 b/d to 9.2 mb/d.
Since OPEC reached a cutback agreement late November last year, U.S. production has gone up by north of 500,000 b/d!
On Wednesday, the day the EIA report came out, spot West Texas Intermediate crude fell 0.5 percent. This followed a 14-percent, 13-session rally from intraday low to high.
The crude has recaptured both 50- and 200-day moving averages as well as $51-$52. Daily conditions are way overbought. The key question is, would the bulls be able to save that support in the days ahead? The 50-day – now flattish – rests at $51.54.
E-mini S&P 500: Currently net long 121k, up 271.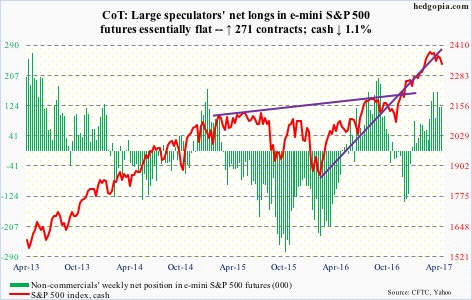
For the first time post-election, the cash (2328.95) closed under the 50-day moving average. Support at 2330-plus is also gone, but the March low of 2322.25 is intact, a loss of which likely opens the door for a test of 2280.
SPY, the SPDR S&P 500 ETF, continued to bleed, losing $1.5 billion in the week ended Wednesday. This was preceded by outflows of $7 billion in the prior week (courtesy of ETF.com).
In the same week, U.S.-based equity funds attracted $1.4 billion, following $11.9 billion in outflows in the prior week (courtesy of Lipper).
From the bulls’ perspective, the good thing is that there was no follow through in last week’s massive outflows.
Euro: Currently net short 19k, up 7.6k.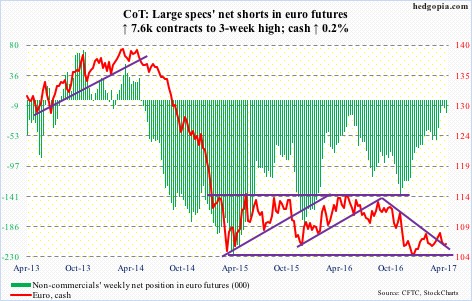
The 50-day moving average on the cash (106.6) – now slightly declining – continued to repel rally attempts. Last week, it lost the rising trend line from January 3. There is support at 105-plus.
The currency has been under pressure since March 27 when it was rejected at the 200-day, which at the time also approximated a declining trend line from last May.
Gold: Currently net long 172.7k, up 17.2k.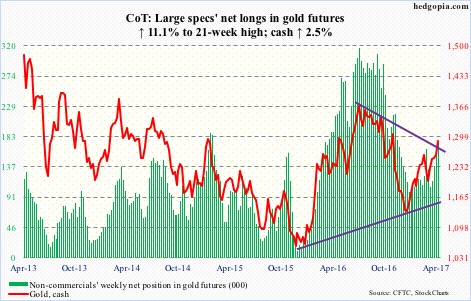
The risk-off sentiment unleashed by Syria airstrikes did wonders to gold. The cash rallied 2.5 percent for the week. After several failed attempts since February 27, the 200-day moving average has been recaptured.
In the week ended Wednesday, GLD, the SPDR gold ETF, gained $239 million (courtesy of ETF.com). This followed inflows of $130 million in the prior week.
The metal also broke the declining trend line from last July when the cash peaked at $1,377.5, before dropping all the way to $1,124.3 by December. This is potentially an important development. Near-term, though, gold bugs likely will be forced to defend the 200-day, and after that possibly the rising 50-day.
Both Wednesday and Thursday produced candles showing fatigue.
Nasdaq 100 index (mini): Currently net long 97.7k, up 3.7k.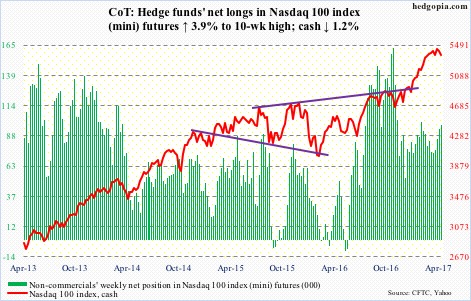
Finally some chink in tech’s armor. The cash (5353.59), down 1.2 percent for the week, is testing its 50-day moving average – first time this year. That said, it is merely 2.3 percent off the all-time high reached on April 5.
A breach of that average would not matter a whole lot if the bulls are able to save support at 5330-ish and then rally. For that, they would need the support of flows.
In the week ended Wednesday, QQQ, the PowerShares Nasdaq 100 ETF, took in $409 million, which followed $900 million in outflows in the prior week (courtesy of ETF.com).
XLK (SPDR technology ETF) shorts are acting as if they expect a break of the afore-mentioned support.
Russell 2000 mini-index: Currently net short 58.4k, up 2.6k.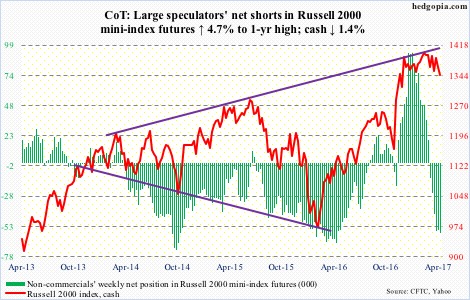
Once again, the cash (1345.24) is sitting on four-and-a-half-month range support. This was preceded by three consecutive sessions in which the 50-day moving average – flat – repelled rally attempts.
Flows are not cooperating.
IWM, the iShares Russell 2000 ETF, lost $1.9 billion in the week ended Wednesday, and $873 million in the prior two (courtesy of ETF.com).
A convincing loss of that support opens the door for a test of the 200-day (1294.99).
US Dollar Index: Currently net long 44.3k, up 1.4k.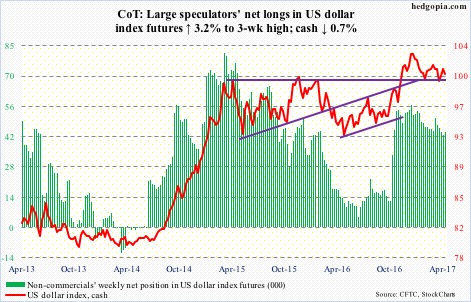
President Trump on Wednesday said that the dollar was getting too strong and that it would eventually hurt the U.S. economy. He has made similar remarks in the past.
Wednesday, the dollar index (cash) inched higher 0.09 percent, reversing intraday losses. Markets are not sure what to make of the Trump administration’s jawboning. Mr. Trump also said he would like to see interest rates stay low. That is a shot across the bows of Janet Yellen, Fed chief, to not to get too restrictive.
For now, the cash (100.46) continues to trade between 50- and 200-day moving averages. It is essentially sideways the past couple of years. Monday, it got rejected at the declining trend line from January 3. There is decent support at 99 and change.
VIX: Currently net short 83.6k, down 10.9k.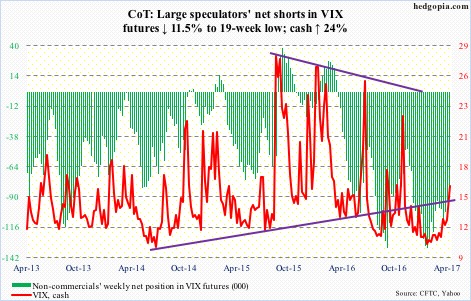
Volatility bulls had a nice week. The cash rallied 24 percent – past its 200-day moving average. On the daily chart, it is overbought, with all four sessions of the week closing above the sharply-rising upper Bollinger band. A spike reversal could signal a near-term top, but has not happened yet.
Not surprisingly, VXX, the iPath S&P 500 VIX short-term futures ETN, in the week ended Wednesday gained $215 million. This followed outflows of $381 million in the prior two (courtesy of ETF.com).
The VIX-to-VXV ratio closed out the week at 1.01, but rose as high as 1.03 on Wednesday. This amounts to plenty of fuel for unwinding, which will help stocks. The trigger, once again, likely comes from a spike reversal in spot VIX.
