
Following futures positions of non-commercials are as of June 13, 2017.
10-year note: Currently net long 274k, up 61.9k.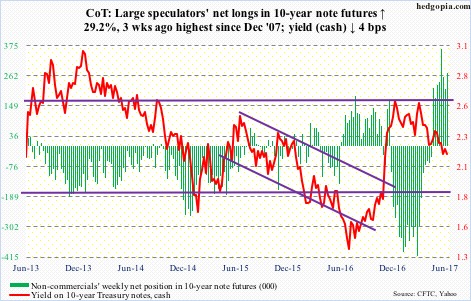
Market reaction to the FOMC decision Wednesday smacked of confusion, to say the least.
As expected, the Fed raised the fed funds rate by 25 basis points to a target range of 100 to 125 basis points. This was the third 25-basis-point hike in the past six months – and fourth since December 2015.
What was not expected was how hawkish the Fed’s message leaned. They plan to hike one more time this year as well as to begin to shrink their bloated $4.5-trillion balance sheet. Next year, they are forecasting three more quarter-point increases!
(However, next year is a big unknown. There are three vacancies to fill on the seven-member Federal Reserve Board. As well, Janet Yellen’s term as chair of the Board expires in February, and Stanley Fischer’s as vice-chair in June. So it is possible the makeup of the FOMC, which consists of 12 members – seven Board members, president of New York Fed, plus four of the remaining 11 regional Fed presidents on a rotating basis – will be totally different.)
In the post-meeting statement, the FOMC stated that the labor market has continued to strengthen and that inflation would stabilize around its two-percent objective over the medium term.
The yield curve begs to disagree. On Wednesday, the spread between 10- and two-year T-yields narrowed to 80 basis points. (This does not help financials, among others.) The long end is clearly not happy about the current tightening trajectory.
Also on Wednesday, core CPI for May was published, and it came in at year-over-year increase of 1.73 percent. This was the second straight sub-two percent rise. Core PCE – the Fed’s favorite measure of consumer inflation – has not been above two percent since May 2012.
For whatever reason, the Phillips Curve, which postulates an inverse relationship between unemployment and inflation, is broken. A 4.3-percent unemployment rate (May) is not generating much inflation.
So why the hawkish message?
In all probability, the Fed is looking to break the back of asset inflation – in equities. In the past, Ms. Yellen has talked about elevated multiples, which, by the way, continue to expand. Since the turn of the century, there have been two instances of excessive valuations – 2000 and 2007 – and none ended well. Both those bear markets accompanied recession.
The current recovery is in its ninth year, so contraction is just a matter of when not if. When the next one hits, having raised by 100 basis points thus far, the Fed at least has some cushion to fall back on.
30-year bond: Currently net long 58.8k, up 35.9k.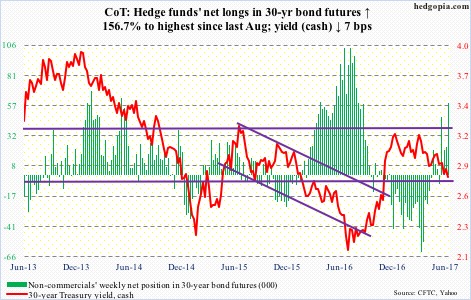
Major economic releases next week are as follows.
Wednesday brings existing home sales for May. April was down 2.3 percent month-over-month to a seasonally adjusted annual rate of 5.57 million units. March’s 5.7 million was the highest since February 2007.
New home sales for May come out on Friday. Sales collapsed 11.4 percent m/m in April to 569,000 units (SAAR). March’s 642,000 was the highest since October 2007.
At least seven FOMC members are scheduled to speak during work week.
Crude oil: Currently net long 426.2k, down 26.6k.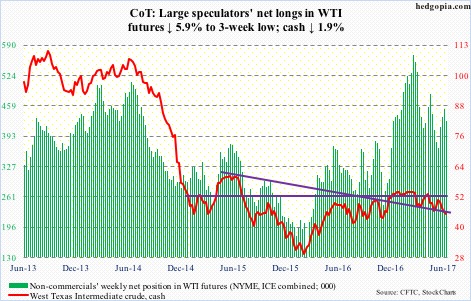
There is support at $42-43 on spot West Texas Intermediate crude. This was tested six weeks ago and held. This is being tested again.
Also, since the crude peaked at $55.03 in February, it has made lower highs and lower lows. Currently, it is at the low end of that channel. Hence its importance!
Even if this holds, the crude needs to stabilize first. Shorter-term moving averages are still dropping.
In the week ended June 9, crude stocks dropped 1.7 million barrels to 511.5 million barrels, but stocks of gasoline and distillates continued to rise – up 2.1 million barrels to 242.4 million barrels and 328,000 barrels to 151.4 million barrels, respectively.
The EIA report also showed that crude production rose 12,000 barrels/day to 9.33 million barrels. Since OPEC reached a cutback agreement late November last year, U.S. crude production has increased by 631,000 b/d.
Crude imports, however, fell – by 316,000 b/d to 8.03 mb/d. Refinery utilization inched up three-tenths of a point to 94.4 percent.
E-mini S&P 500: Currently net long 57.8k, down 710.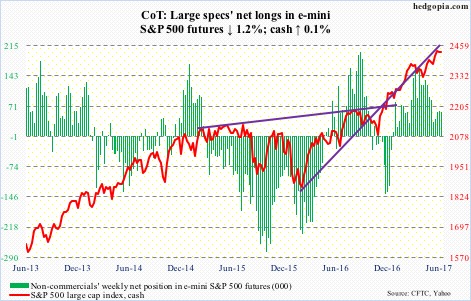
Bulls and bears are fighting a tug of war around 10- and 20-day moving averages on the cash. The former was not able to cash in on the inflows. The cash inched up 0.06 percent during the week.
In the week to Wednesday, SPY (SPDR S&P 500 ETF) gained $5.4 billion (courtesy of ETF.com). Another $4.8 billion moved into IVV (iShares core S&P 500 ETF) and VOO (Vanguard S&P 500 ETF) – $4.5 billion and $327 million, respectively.
In the same week, $10.9 billion moved into U.S.-based equity funds (courtesy of Lipper).
The real question is, will the bulls come up with funds when 2400 is tested? The S&P 500 broke out of it three weeks ago. The 50-day is right around there – currently 2393.18 and rising.
Euro: Currently net long 79.1k, up 5k.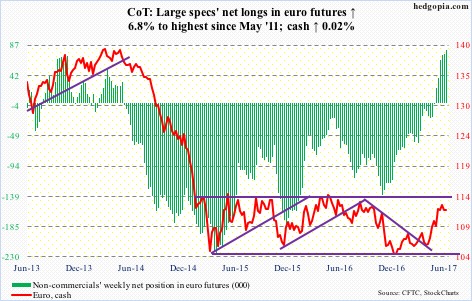
Post-FOMC decision Wednesday, the cash (111.97) jumped 0.8 percent intraday to 112.99 before giving up the gains and closing essentially unchanged.
The consolation for the bulls is that by Friday the currency was able to reclaim one-month support at 111.6. However, shorter-term moving averages are rolling over. Failure to reclaim those would open the door for unwinding of weekly overbought conditions.
In April, the currency had an important break out of 108-plus, which also approximates the 200-day moving average.
Gold: Currently net long 190.3k, down 14.2k.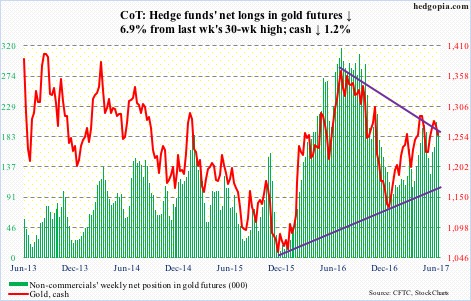
Back in December 2015 when the Fed hiked for the first time in nine-plus years, gold (cash) reached an important bottom at $1,045.4. One year goes by, and there was another hike; once again, gold bottomed at $1,124.3. The streak continued in March this year, as the metal bottomed at $1,194.5.
The Fed just hiked. So will the pattern continue?
The cash lost the 50-day Thursday. Although in the week ended Wednesday, GLD (SPDR gold ETF), did attract $178 million (courtesy of ETF.com).
Resistance proved tough at $1,300, which repelled breakout attempts twice in the past couple of months. The 200-day lies at $1,242.84. Right around there lies a rising trend line from last December – a must-hold.
Nasdaq 100 index (mini): Currently net long 101.6k, up 9.1k.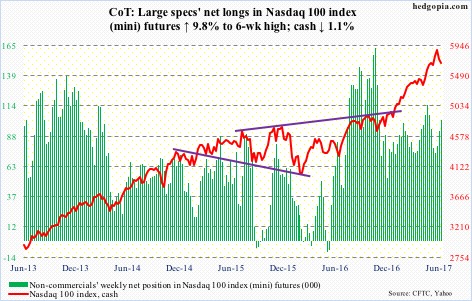
After last Friday’s 2.4-percent rout, the cash (5681.48) began the week by finding support at the 50-day, followed by rejection at the 20-day. The 50-day was defended again Thursday. Bulls cannot afford to lose this as well as horizontal support at 5450.
Flows are not helping.
In the week through Wednesday, QQQ (PowerShares Nasdaq 100 ETF), lost $486 million (courtesy of ETF.com).
Russell 2000 mini-index: Currently net long 7.5k, up 43.2k.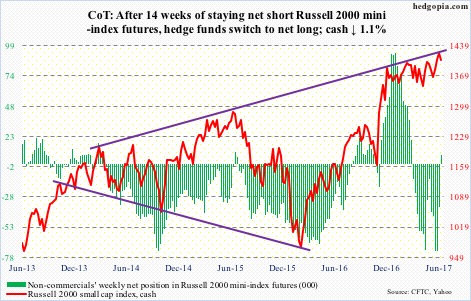
Early this month, the cash broke out of a six-month rectangle, followed by a new high of 1433.79 on the 9th. Previously, there were two false breakouts – one in February and the other in April. Each of the breakouts brought a new high, thereby helping forge a rising channel.
Last week, the index was rejected at the top of that channel, the bottom of which lies around 1360. The 50-day (1388.88) will be tested before that; right around there lies the top of the afore-mentioned 1340s-1390s box.
The point is, there is support, but it needs to be defended.
In the week ended Wednesday, IWM, the iShares Russell 2000 ETF, attracted $2.2 billion (courtesy of ETF.com). Will flows cooperate when they are needed?
Importantly, in the past couple of weeks, non-commercials’ holdings went from 73k net shorts to 7.5k net longs. Bulls were not able to cash in on this squeeze, as the cash went sideways.
US Dollar Index: Currently net long 28k, down 197.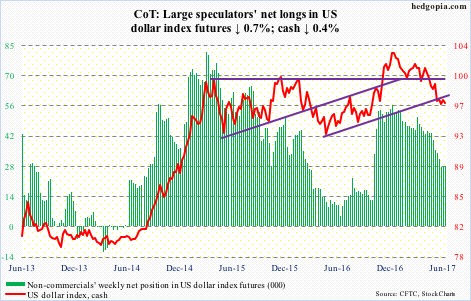
The cash responded to the Fed’s hawkish language Wednesday by initially dropping 0.7 percent before bids showed up to essentially close the session unchanged. This was followed Thursday by defense of the lower Bollinger band.
On the daily chart, a bullish crossover between 10- and 20-day seems to be in the works, even as the Bollinger bands have tightened.
VIX: Currently net short 129.8k, down 6k.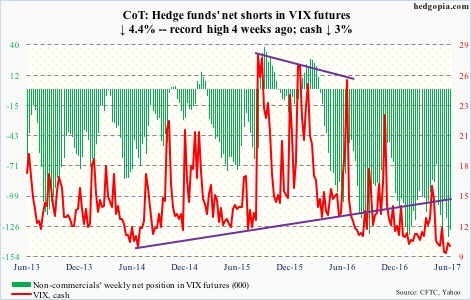
Last week’s intraday high of 12.11 was surpassed Monday when the cash rallied to 12.37, but once again, it failed to hold. Twice in the week, VIX (10.38) rallied past the 50-day intraday, only to close under.
VIX continues to linger around the bottom of a multi-year range, but lifting off of it has proven difficult. That said, when it does, it has shown a tendency to do that in a hurry. In May, intraday it jumped from 9.56 to 15.71 in eight sessions.
