
Following futures positions of non-commercials are as of May 16, 2017.
10-year note: Currently net long 240k, up 10.9k.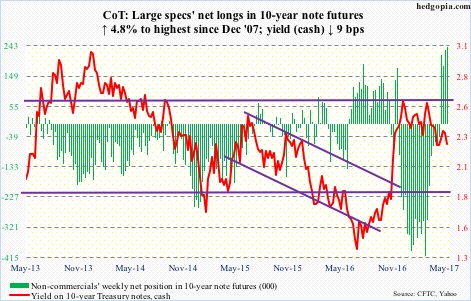
Non-commercials nailed it. In the prior week, they had built net longs to the highest since December 2007, and were rewarded. This week, they added.
Through Thursday, TLT, the iShares 20+ year Treasury bond ETF, was up 2.1 percent this week, and 10-year yields shed 14 basis points to 2.19 percent, ending the week at 2.23 percent.
Yields also fell out of the 2.31 percent-2.62 percent five-month range on Wednesday. The 200-day moving average rests at 2.14 percent.
The action in the long end continues to confound. The yield curve (10s/2s) has narrowed to 95 basis points, and is simply not buying ‘the economy is about to accelerate’ meme. Nor is it on board the reflation trade that stocks in particular have enthusiastically embraced post-election.
The odds of a 25-basis-point rise in June (13-14) remained unchanged at 79 percent this week. June looks like a lock. The Fed plans to hike at least twice this year.
Around the time the Fed hiked last December and this March, 10-year yields tried to, but could not, break out of 2.62 percent. They meet in about four weeks’ time. A lot can happen between now and then. But as things stand, it does not look like 2.62 percent will even be tested leading up to/around the June meeting.
30-year bond: Currently net short 6.8k, up 12k.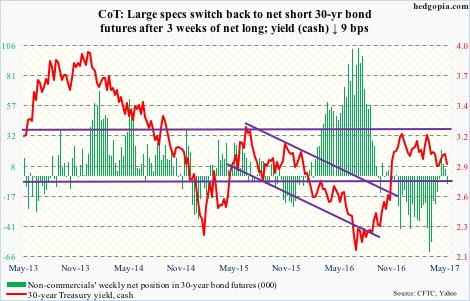
Major economic releases next week are as follows.
April’s new home sales are published on Tuesday. March was up 6.2 percent month-over-month to a seasonally adjusted annual rate of 621,000 units, just shy of 622,000 last July, which was the highest since 627,000 in January 2008.
Existing home sales (April) and FOMC minutes (May 2-3 meeting) are due out on Wednesday.
Sales of existing homes rose 4.4 percent m/m in March to 5.71 million units (SAAR) – the highest since February 2007.
Friday brings durable goods orders (April), GDP (1Q17, second estimate), corporate profits (1Q17, preliminary) and the University of Michigan’s consumer sentiment (May, final).
Orders for non-defense capital goods ex-aircraft – proxy for business capex – rose 3.3 percent year-over-year in March to $65.2 billion (SAAR). This was the fourth straight y/y increase after 17 months of contraction. Orders peaked at $70.7 billion in September 2014.
Preliminarily, real GDP rose 0.7 percent in 1Q17, much weaker than the post-Great Recession average of 2.1 percent, which in itself pales in comparison to the long-term average of 3.2 percent.
Corporate profits adjusted for inventory and depreciation jumped 9.1 percent y/y in 4Q16 to $2.15 trillion (SAAR). This was the third y/y increase in four quarters, following four consecutive quarters of contraction. Profits peaked at $2.22 trillion in 4Q14.
May’s preliminary estimate showed consumer sentiment rose seven-tenths of a point m/m to 97.7. The cycle high 98.5 – a 13-year high – was reached in January.
Crude oil: Currently net long 367.8k, down 12k.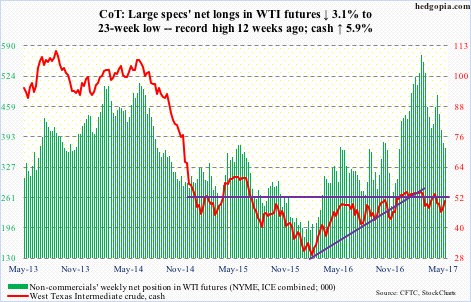
The EIA report out Wednesday contained more positives than negatives.
For the week ended May 12, stocks of crude, gasoline and distillates all fell – respectively by 1.8 million barrels to 520.8 million barrels, 413,000 barrels to 240.7 million barrels, and 1.9 million barrels to 146.8 million barrels.
Crude production fell, too – down 9,000 barrels/day to 9.3 million b/d. This was the first week-over-week drop in 13 weeks. Since OPEC reached a cutback agreement late November last year, U.S. crude production has increased by north of 600,000 b/d.
Refinery utilization increased 1.9 percentage points to 93.4 percent – a three-week high.
Crude imports, on the other hand, rose 970,000 b/d to 8.6 mb/d.
On the back of this, bulls rallied spot West Texas Intermediate crude ($50.67) 0.8 percent Wednesday, followed by a rally Thursday that took it past both 50- and 200-day, which are converging ($49.40 and $49.42, respectively). Friday brought more gains.
A three-month declining trend line gets tested around $52.
E-mini S&P 500: Currently net long 32.1k, down 52.9k.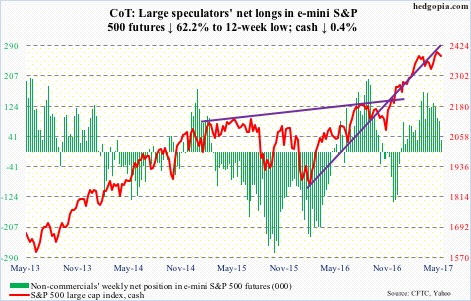
Bulls’ inability to convincingly take out 2400 continued, but at the same time dip buyers have not given up. A day after notching a new intraday high of 2405.77, the cash (2381.73) dropped 1.8 percent on Wednesday.
Bulls needed to save 2325, or 2280 in a worse-case scenario. The latter is where a rising trend line from February last year rests. A must-save! Those levels were not even tested. From the Thursday low, the S&P 500 rallied 1.2 percent.
That said, medium-term, both weekly and monthly conditions are in overbought territory and are probably itching to go lower. The 50-day is beginning to flatten out.
Last July, the S&P 500 had a major breakout at 2120, followed by a successful retest pre-election.
Amidst all this, flows are struggling. In the week to Wednesday, SPY, the SPDR S&P 500 ETF, lost $2.2 billion (courtesy of ETF.com). In the past three, $8.6 billion has been redeemed.
Ditto with U.S.-based equity funds, which lost $1.2 billion in that week – $7 billion in the last three (courtesy of Lipper).
Incidentally, foreigners of late have been a tailwind for U.S. stocks. In the 12 months to March, they purchased $47.1 billion worth. In February last year, they were selling as much as $142 billion worth – a record. The last to jump on the rally train?
Euro: Currently net long 37.6k, up 15.2k.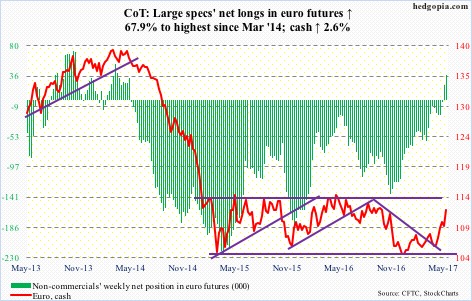
The cash is benefiting from both relatively strong Eurozone data as well as the dollar’s woes. Year-over-year core inflation, for instance, rose from 0.7 percent in March to 1.2 percent in April. The US dollar index, which assigns 57.6 percent weight to the euro, has been on the back foot.
The euro (112.07) has rallied in five of the last six weeks. Going back further, it started 2017 at 103.41 (intraday low), and has come a long way. It is looking way overbought on the daily chart, but momentum is intact, having broken out this week of a falling trend line from August 2015.
Non-commercials have been adding to net longs.
Gold: Currently net long 126.7k, down 23.3k.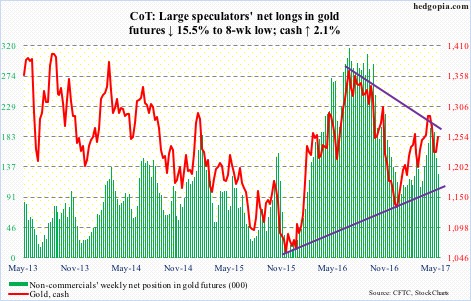
Wednesday was risk-off. The cash rallied 1.8 percent in that session. But GLD, the SPDR gold ETF, was unable to attract any funds. In fact, in the 14 sessions to Wednesday, the ETF saw activity only once – that of redemptions of $46.8 million on May 8 (courtesy of ETF.com).
Despite this, the fact that the metal ($1,253.6) rallied 2.1 percent this week should hearten gold bugs.
Gold’s near-term outlook improves if it is able to break out of a declining trend line from last July. It was denied Thursday when it retreated from $1,265.
Nasdaq 100 index (mini): Currently net long 78.5k, down 15.9k.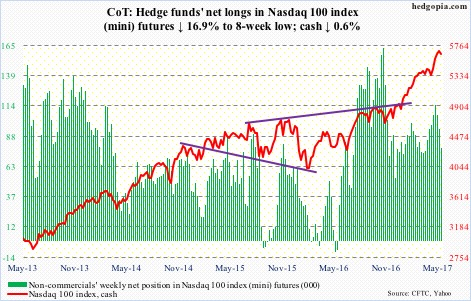
In the week ended Wednesday, QQQ, the PowerShares Nasdaq 100 ETF, experienced redemptions every day, to the tune of $728 million (courtesy of ETF.com). The Nasdaq 100 (5651.56) went on to score a fresh high (5724.71) on Tuesday.
Too soon to say if Wednesday’s 2.5-percent drop is the beginning of something big. Momentum is yet to break. The last time it traded below its 50-day (5493.36) was early December last year.
That said, the prevailing rally is primarily led by the heavy-weights. Medium- to long-term, risk/reward dynamics probably favor the former. The week produced a spinning top candle. First layer of decent support lies at 5450.
Russell 2000 mini-index: Currently net short 43.9k, up 3.8k.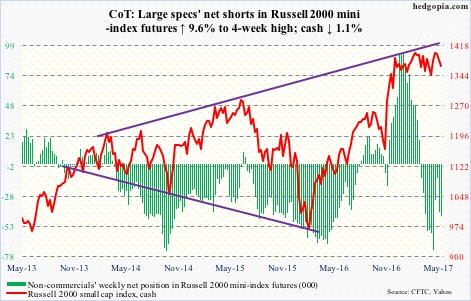
After defending the 50-day several times in the prior nine sessions, the cash (1367.33) sliced through the average on Wednesday when it deflated 2.8 percent. Intraday Thursday, it came close to testing the bottom of the 1390s-1340s range, which has been intact for over five months now, before finding support.
The daily chart is oversold. What transpires at the 50-day (1377.74) – or even at/near range top – will be a big tell as to how things may trend next. Medium- to long-term, risk is to the downside.
In the week ended Wednesday, IWM, the iShares Russell 2000 ETF, lost $1.2 billion. In the prior week, an equal amount was withdrawn (courtesy of ETF.com).
US Dollar Index: Currently net long 34.3k, down 1.5k.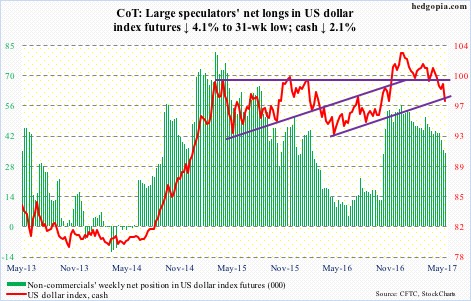
The cash (97.03) is on pace for three straight monthly decline – and four out of five. It peaked early January this year at 103.82 after breaking out of resistance at 100.70, which goes back to March 2015. Turns out it was a false breakout. The dollar index has lost that support, as well as a rising trend line from last May.
It is oversold, but needs to stabilize. Resistance lies at 98.6, and the 200-day (99.12) after that.
VIX: Currently net short 142.4k, up 26.7k.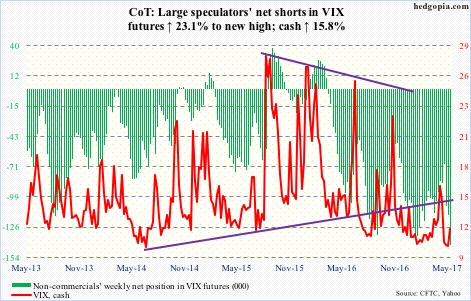
From an intraday low of 9.56 on May 9 to a high of 15.71 on May 18, the cash (12.04) exploded higher Wednesday but only to give back most of those gains by Friday.
Non-commercials likely played a role in Wednesday’s 46.4-percent surge in the cash as they had built most net shorts by Tuesday.
In the past, reversals following similar spikes have resulted in volatility contraction. The 200-day (12.87) was lost as quickly as it was recaptured. Ditto with the 50-day (12.16).
Down the road, a golden cross – potentially bullish for volatility – is possible. Less than a point separates the two, even as VIX continues to linger around the bottom of its multi-year range.
