
Later today at 1:15 PM, Janet Yellen, Fed chair, speaks at Harvard University. Markets will be on pins and needles waiting to hear what she will say. She is appearing in public in the wake of several hawkish comments/speeches from regional Fed presidents over the past couple of weeks.
Thus far, Ms. Yellen has maintained a dovish stature. Should she change her tune – either real or perceived – that potentially reverberates through markets, the bond market including.
In this respect, the two-year Treasury yield – most sensitive to Fed action – rallied from 0.72 percent on May 10th to 0.92 percent this Wednesday, before coming under pressure. The 20-basis-point rather quick move was in apparent reaction to the afore-mentioned hawkish comments from FOMC members, and maybe to expectation of a hawkish Yellen today.
Ordinarily, a hawkish message from her can be expected to put rates – short-term in particular – under upward pressure. Last December, the two-year rose all the way to 1.09 percent. That said, these yields have already had a sharp jump. So in a typical ‘buy the rumor, sell the news’ fashion, rates can drop, too.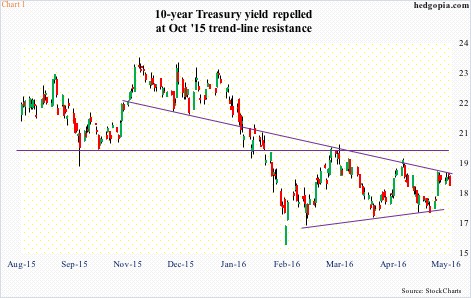
In fact, the 10-year Treasury yield, having risen from 1.71 percent on May 13th to 1.88 percent three sessions later, has gone sideways since, right along its 100-day moving average, which also approximates a declining trend line from last October (Chart 1). Daily conditions are overbought, so rates can come under pressure.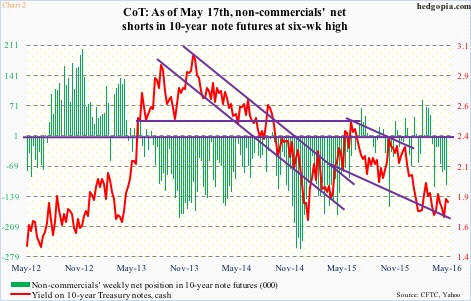
If this scenario unfolds, non-commercial futures traders are positioned the wrong way. As of the 17th, they were net short 112,328 contracts in 10-year-note futures (Chart 2). They were net long just two months ago. (The latest numbers, as of this Tuesday, will be reported later today.)
Short interest on TLT, the iShares 20+ year Treasury bond ETF, has a similar bias. Short interest is not as high as late last year/early this year, but has essentially gone sideways the past several periods. From the March 31st low of 8.3 million shares, mid-May short interest has gone up substantially (Chart 3). These shorts obviously would do well if TLT comes under pressure, and rates head the other way, but can easily get squeezed, too.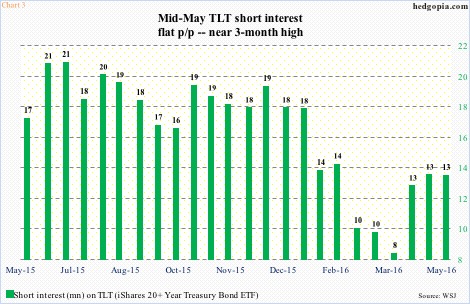
In the latter scenario, TLT potentially can once again have a go at the one-plus year resistance at $132.50. Barring a couple of false breakouts (arrows in Chart 4), this resistance has been in place since January last year. Since February this year, it has resisted rally attempts three times. Down below, there is decent support at $127.
Technically, if weekly conditions prevail, TLT’s likely path of least resistance is down. Also on a daily basis, it has room to come under pressure, with the past seven sessions hovering near the 50-day moving average. But the issue right now is how it reacts today – or near term – and what will drive it.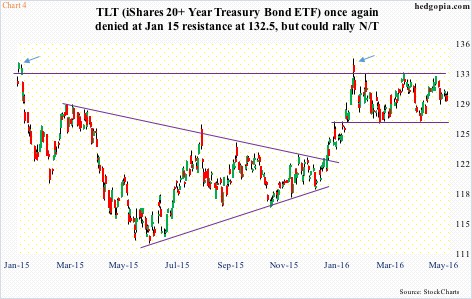
Both scenarios are possible – either it rallies or not. The ETF itself is in the middle of the range it is in (Chart 4).
So… given all that. Tactically, it is prudent to stay out of the way.
To refresh, hypothetically TLT ($130.04) was shorted on May 17th at $131.14 on the belief that the afore-mentioned resistance would hold. That is indeed the case. At the same time, uncertainty has increased. Worth covering for now for $1.10 in profit.
Thanks for reading!
