
Notice the plateauing to slightly rising red line in Chart 1?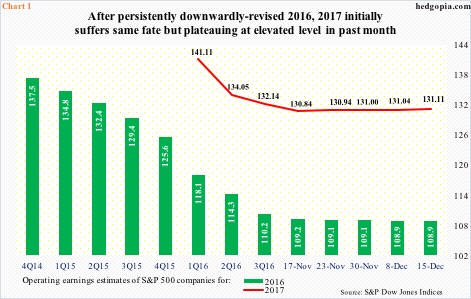
In the middle of January this year, 2017 operating earnings estimates of S&P 500 companies were started out at $141.11. At the time, 2016 estimates were just north of $118, and had been revised downward from $137.50 in February last year. The downward revision trend continued, with 2016 now at $108.94. Ditto with 2017, but with a twist.
Next year’s estimates bottomed on November 17 at $130.84, and stood at $131.11 on December 15. In other words, 2017 estimates have gone up by $0.27 in about a month. This is what the red line in Chart 1 shows. The slightly rising revision trend in next year’s estimates has taken place in the wake of Donald Trump’s win in the presidential election on November 8.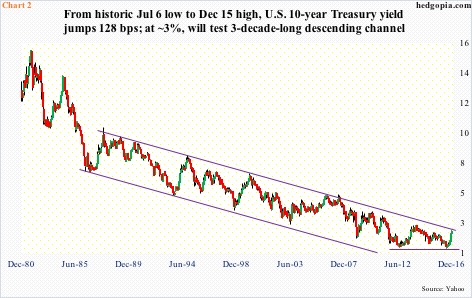
A lot of optimism has been built into next year. The president-elect’s plan to reduce taxes, cut regulations, and boost infrastructure spending has rekindled animal spirits. Sort of. There has been a palpable rise in growth optimism – reflected across asset classes.
Interest rates have jumped. Ten-year yields made a historic low on July 6 this year at 1.34 percent, and had been under gradual upward pressure. Post-election, however, they went parabolic – from 1.82 percent on November 8 to 2.62 percent on December 15. That is a jump of 80 basis points in five weeks! The entire yield curve has been rerated, albeit with some flatness of late.
Chart 2 is a monthly chart, hence does not show the post-election daily spike in 10-year yields, but does highlight this. Yields are still under a three-decade-old descending channel, and will break out at just over three percent.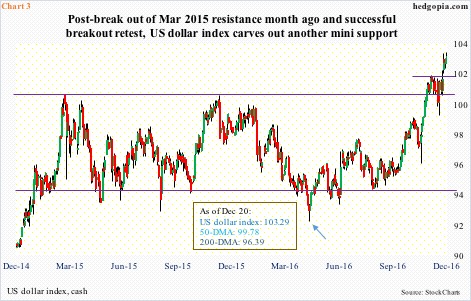
The US Dollar index had been rising since May this year (arrow in Chart 3). But post-election, the rally took a life of its own – up north of five percent. To boot, it has managed to break out of crucial resistance.
The dollar index peaked at 100.71 in March last year. The level was unsuccessfully tested in November that year, and later again this November. A breakout occurred on November 17 (Chart 3). Breakout retest has taken place in the past four weeks, and has held thus far. In fact, 102 is the new near-term support.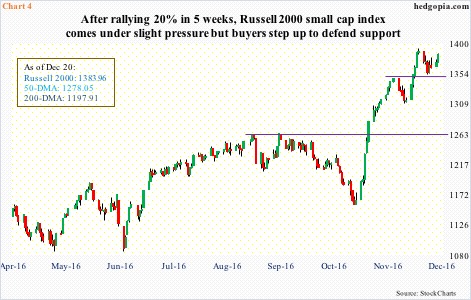
Sectors such as utilities and consumer staples took it on the chin post-election, but for the most part stocks have done well.
Small-caps have had quite a ride! From an intra-day low on November 3 through December 9, the Russell 2000 small cap index jumped 20-plus percent – and 16-plus percent post-election (Chart 4)! In the process, it finally broke past the June 2015 high of 1296.
In fact, by the time the Russell 2000 scored a new high, U.S. large-caps had already done so. Post-election, however, the laggard turned into the leader. Like that. One reason has something to do with Chart 3. A strong dollar hurts export-oriented companies more than those that are domestically focused, which is what small caps inherently are. At least that is what the conventional wisdom tells us. Or that, because of their domestic focus, small-caps benefit more from lower taxes.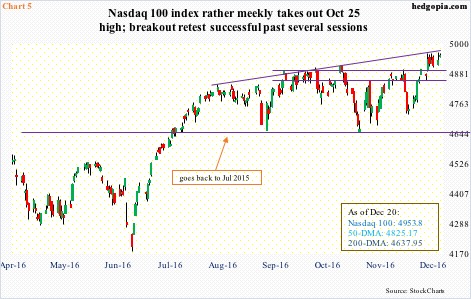
If we just focus on small-cap stocks, the environment is quite risk-on out there. Not if we turn our focus on the tech-heavy Nasdaq 100 index.
On October 25 this year, the Nasdaq 100 reached a new high of 4911.76. It was not until December 13 the index surpassed that high. Post-election, it went sideways for nearly a month, even as other major indices were rallying hard.
This is reflected in flows. From November 9 through December 19, merely $1.7 billion moved into QQQ, the PowerShares Nasdaq 100 ETF, versus $5.7 billion into IWM, the iShares Russell 2000 ETF, and $17.1 billion into SPY, the SPDR S&P 500 ETF.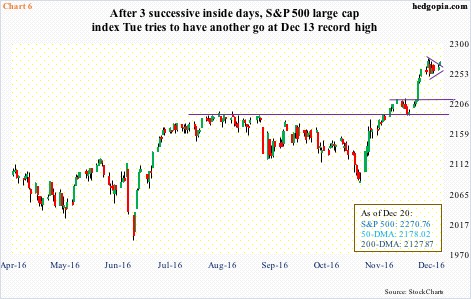
Thanks to these flows, post-election through the all-time high 2277.53 on December 13, the S&P 500 large cap index rallied six-plus percent (Chart 6). On a daily basis in particular, it is grossly overbought, but has been that way for several weeks now. As of Tuesday, the index is 4.2 percent away from its 50-day moving average, and 6.6 percent from its 200-day. No sign of major distribution.
No one seems ready to ring the register just yet.
December tends to be a seasonally favorable period for stocks, even though the month was down in both 2014 and 2015. Because Mr. Trump is talking about tax cuts, the overriding temptation is to wait the month out and lock in the gains next year.
Last year, the S&P 500 started to sell off on December 30, and by January 20 was down 13 percent. Odds of something similar happening early next year or leading up to the January 20th inauguration day? Pretty decent.
Despite all the excitement over Mr. Trump’s plans, there is a way to go before they become a reality. Congress is controlled by the Republicans, but there are budget hawks. The U.S. economy is in its eighth year of recovery, but still runs a deficit. The federal debt has grown from $11.5 trillion at the end of 2Q09 to $20 trillion … which is likely to play a role when Congress votes on tax and spending matters. The uncertainty resulting out of this is probably not in the price.
Hence the importance of support levels on the afore-mentioned indices. Once they are lost, the urge to cash in becomes paramount.
On the S&P 500, 2215 is the first line of support, followed by 2190-ish, and then 2120-2130 (Chart 6). On the Nasdaq 100, 4900-4910 comes first, followed by 4840 and then 4740 (Chart 5). And on the Russell 2000, 1350-ish is the near-term support it recently carved out. After this lies major support at 1260-1300 (Chart 4).
Thanks for reading!
