
The equity rally that began on February 11th has brought bad news to the shorts. Obviously.
They have two choices: (1) stay short, which means holding a losing trade, or (2) cover, which will add more fuel to the rally, hurting (1) even more.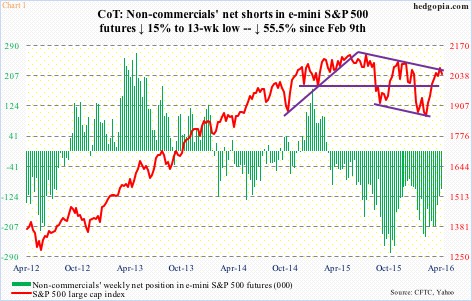
Non-commercials who were net short S&P 500 e-mini futures and have been covering belong to the second category. In the week ended February 9th, they had 234,321 contracts in net shorts, dropping to 104,210 by last Tuesday (Chart 1).
Off the February 11th intra-day low through the April 1st high, the S&P 500 index rallied nearly 15 percent. Non-commercials who reversed their positions probably contributed to this.
There was a similar phenomenon post-August/September sell-off last year. Non-commercials’ net shorts declined from 278,179 on October 6th to 75,348 mid-December. Off late-September lows, the S&P 500 rallied 13 percent in five weeks.
Back then, also helping the rally was the reduction in short interest on both the NYSE composite and the Nasdaq composite.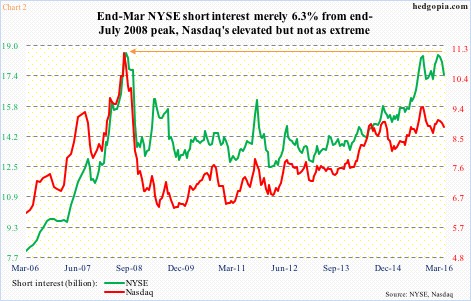
NYSE short interest dropped from 18.43 billion shares on September 30th to 17.26 billion on November 13th for a drop of 6.3 percent. On the Nasdaq, it went from 9.48 billion to 8.88 billion, for a drop of 6.2 percent (Chart 2).
This time around, short interest is hanging in there, even though stocks have rallied more.
On the NYSE, short interest dropped from 18.51 billion on February 12th to 17.44 billion on March 31st. On the Nasdaq, it went from 9.08 billion to 8.89 billion. This is a drop of 5.8 percent and 2.4 percent, in that order.
Shorts are doggedly staying short. Incidentally, NYSE short interest is only 6.3 percent from the end-July 2008 peak. Well-placed conviction or recipe for squeeze down the line?
If we look at factors such as decelerating earnings, buyback blackout, overbought technical conditions, outflows from equity funds, among others, it is perhaps fitting to lean bearish. The risk of course is what has transpired since February 11th – a rally followed by a squeeze.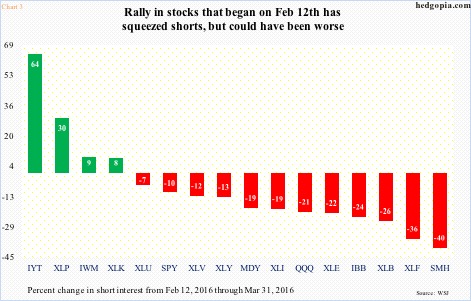
In fact, since February 11th through March 31st, several ETFs came in for a much harsher treatment than did either the NYSE or the Nasdaq. That said, Chart 3 is rather revealing. The extent of squeeze seen during the period is less intense than is seen in Chart 4. The latter covers the September 29th-November 3rd period, during which the S&P 500 rallied 13 percent, but it caused bigger squeeze than did the rally since February 11th.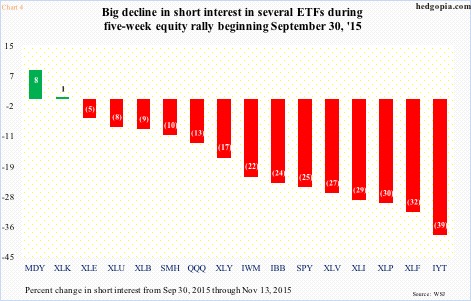
Hence the question, is there more to come – squeeze, that is? While theoretically possible, odds are probably heavily stacked against that. If nothing else, just for the reasons mentioned earlier that are currently acting as headwinds.
Thanks for reading!
