
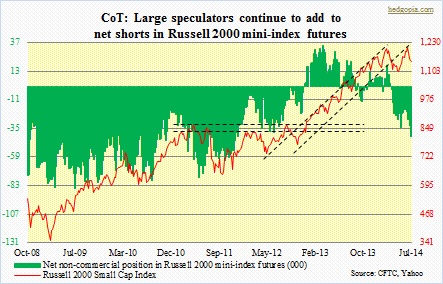
 Small-cap shares are lagging. This is no news. Small-caps have been a topic of discussion on this blog several times before. They have lagged their large-cap brethren, the S&P 500 Index, since early March. That was when money started to flow out of these stocks in earnest. The subsequent rally that began mid-May took the Russell 2000 Small Cap Index all the way back to those March highs, but that test failed. Year-to-date, small-caps are now down 1.5 percent, versus an increase of 6.8 percent for large-caps, represented by the S&P 500 Index. Quite a divergence! The question is, is this a canary in the coal mine? Large-caps tend to draw a sizeable portion of their business from overseas. Small-caps by nature are exposed more to the domestic economy. They are also viewed as a barometer for investors’ risk appetites. So for them to be lagging at this stage of the economic cycle and in the sixth year of the equity bull market naturally raises some eyebrows. For now, medium-term technicals continue to point to pressure ahead. Near-term, technicals are oversold, and shares could try to rally, but that in all probability will be transient. This is also the message coming from the futures market. Non-commercials further added to net shorts in Russell 2000 mini-index futures, having risen from -19k contracts in the first week of June to -42k last week.
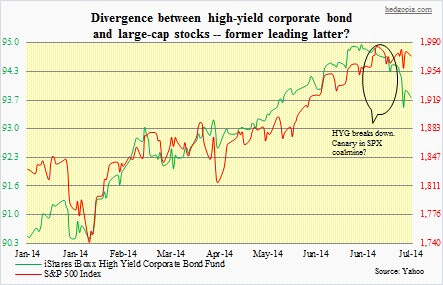 While on the topic of divergence, here is one more. Typically, high-yield corporate bonds behave more like stocks than bonds. Ironically, yields on such bonds are not living up to their name. They were yielding just below five percent in June! In a yield-starved environment and amidst investor belief that the Fed provides a backstop for the entire market, investors have not shown any hesitancy in moving up the risk curve. But something has changed lately. Both HYG (iShares iBoxx High Yield Corporate Bond Fund) and JNK (SPDR Barclays High Yield Bond ETF) peaked late June and quickly shed 1.5-1.6 percent before trying to stabilize. In bond land, that is a sizable drop, and was quick – kind of reminds me of the small-cap two-and-a-half-month meltdown beginning early March. The adjacent chart shows the breakdown in the relationship between HYG and the S&P 500 Index. It is too soon to say if it is even a breakdown, and if it is, the time it will take for the latter to catch up with the former. We know this much. Long-term, HYG is grossly overbought. Medium-term, the process of unwinding overbought conditions has already begun, and probably has a ways to go.
