
The US dollar index (cash) acts confused.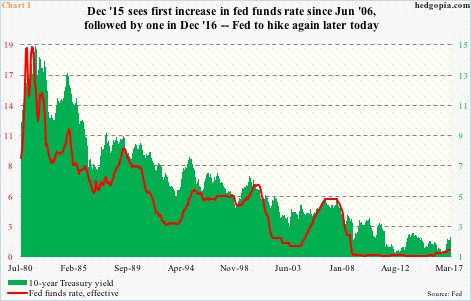
Later today, it is all but certain that the Fed announces a hike in the fed funds rate. This would be the third increase since December 2015, when for the first time since June 2006 rates inched up from a target range of zero to 25 basis points. After two 25-basis-point hikes – the second one last December – rates linger at 0.66 percent.
A 25-basis-point increase today would set the target rate at 0.91 percent – still sub-one percent. A look at Chart 1 reveals just how suppressed this remains historically. That said, it is also a given that from these levels the path of least resistance is up.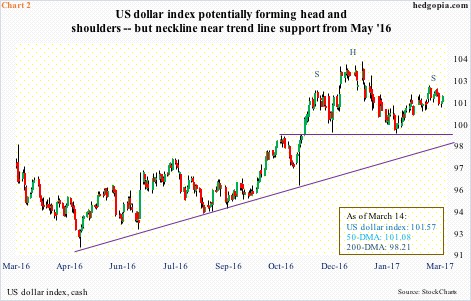
In normal circumstances, higher rates should provide a tailwind to the dollar.
Most recently, the dollar index bottomed on May 3 last year at 91.88, then rallying to 103.82 by January 3. Along the way, it recaptured important trend line resistance at 100.7 going back to March 2015, only to lose it again, as by February 2 it fell to 99.2. It has remained above that support/resistance for the past five weeks – but barely.
Given how quickly markets rerated odds of a March hike and given prevailing expectations that there would be at least two more hikes this year, the dollar index’s inability to sit comfortably above the said support/resistance is a head-scratcher.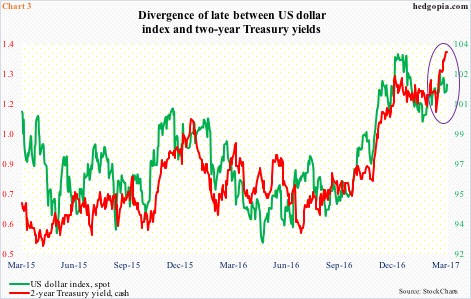
In fact, it has stopped moving in tandem with two-year Treasury yields, which tend to be the most sensitive to the Fed’s monetary policy. Back on December 15 last year (FOMC met on 13-14 that month), these yields rose to 1.29 percent before backing off, and the dollar index rose to 103.53 before closing the session off at 103.11. Tuesday, they were respectively 1.4 percent and 101.57. The divergence is seen in Chart 3 (oval).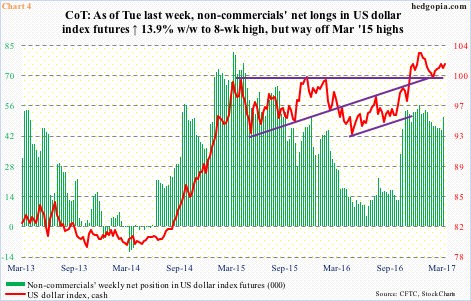
This is probably why non-commercials remain hesitant about aggressively going net long US dollar index futures. As of Tuesday last week, they held 51,051 net longs, up 13.9 percent week-over-week to an eight-week high. But this pales in comparison to the 81,270 contracts they held in March 2015, when the dollar index began retreating after hitting 100.71 (Chart 4).
Hence the confusion.
The dollar index is probably focused on the yield curve, which from around the time the last hike took place has flattened. A flatter yield curve is not an indication that the economy is set to boom in months/quarters to come. For it to act better, the economy has to be doing better. This is not yet signaled by the long end. It is as if the long end is warning the Fed not to get too tight.
With this as a background, one way the dollar index could potentially rally is if post-FOMC meeting/rate decision today, the 10-year breaks out of 2.6 percent. This is an important level – goes back to February 2009 – and Janus Capital’s Bills Gross’s line in the sand.
Else, the dollar index probably continues to act confused.
As things stand, on the daily chart, there is a potentially bearish head-and-shoulders formation, the neckline of which rests just north of 99 (Chart 2). A break can hand the ball over to dollar bears. That said, right underneath lies trend line support from last May, which bulls are likely to defend. No clear signal. More confusion. A break of both, however, is dollar negative.
Thanks for reading!
