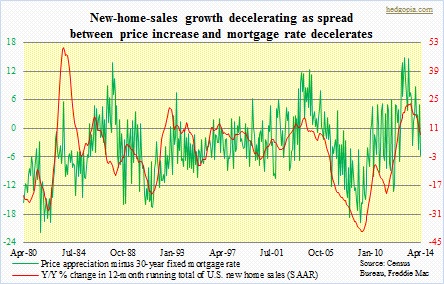
 Sales of new homes are struggling to maintain their earlier momentum. The three-month moving average flat-lined for nearly a year before peaking at 448k (SAAR) in January this year. Those for sale (supply) has been gradually inching up as well – from 142k in July 2012 to 190k (not seasonally adjusted) in April. Monthly data tends to be volatile, hence the accompanying chart is based on a running 12-month total. Sales peaked in January this year, while year-over-year growth peaked in June last year and has been in deceleration since.
As is evident from the chart, price appreciation and interest rates are two important variables. Increase in the median price of a new home has been decelerating since late 2012. Right around that time, the 30-year fixed mortgage rate bottomed. From the perspective of luring new buyers into the market, the combo of decelerating increase in price and higher interest rates does not help. Buyers – or even better, flippers – have an incentive to purchase if the rate at which the price of a home appreciates is higher than the mortgage rate. In April, the spread turned negative.
Price appreciation cuts both ways. From the viewpoint of, let us say, first-time buyers, rapid price appreciation probably takes away the incentive to purchase, as homes increasingly become unaffordable. Investors, on the other hand, have a different objective altogether. In an environment in which price appreciates in a sustained manner, investors have sufficient time to make a purchase and exit on time for a profit. In the current environment, the latter group increasingly is less of a variable. To top it off, this has come at a time when fewer and fewer households are being formed.
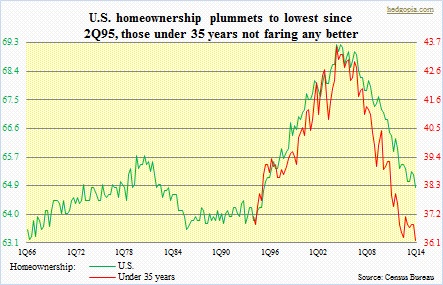 In 1Q14, U.S. home ownership dropped to 64.8 percent, down from 69.2 percent in 4Q04. The drop has been steady and consistent, and across age group – ‘under 35 years’ from 43.6 percent in 2Q04 to 36.2 percent currently, ‘35 to 44 years’ from 70.1 percent in 1Q05 to 60.7 percent currently, ’45 to 54 years’ from 77.4 percent in 4Q04 to 71.4 percent, ’55 to 64 years’ from 82.4 percent in 2Q04 to 76.4 percent, and ’65 years and over’ from 81.8 percent in 3Q04 to 79.9 percent. The drop has been pronounced among age groups that in the past have been the building block behind any housing recovery – first-time home buyers. It is easy to see why. Five years after Great Recession was declared over, non-farm employment is merely back at the pre-recession level. The civilian labor force participation rate stood at 62.8 percent in April, versus a high of 67.3 in April 2000; most recently, it peaked at 66.2 in January 2008. Simply put, fewer jobs translates to fewer household creation.
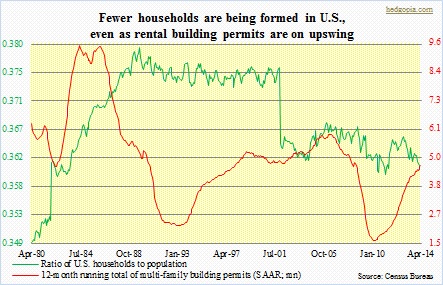 Household formation is not keeping up with growth in population. The ratio of households to population peaked way back in 1989, but the drop has been most pronounced since 2001. From lower left to upper right – that is how U.S. population plots in a chart. Households, on the other hand, have failed to keep up the same momentum, peaking at 115.1mn in October 2012 and dropping to 114.6mn by March this year. We have heard stories of how millennials are moving back in with parents in order to save expenses. This is the age group that needs to be forming new households, and create demands for homes, autos, and what not. And given the tentative nature of the economic recovery, this is not going to change any time soon. This is understood very well by operators of rental units. After bottoming at a mere 106k units (SAAR) in July 2009, multi-family building permits have consistently risen, with the 12-month running total of 4.6mn in April.
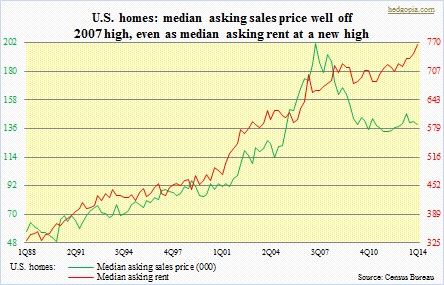
This same fact can be presented in a different way. The chart below depicts the median asking price of a home as well as for rental, and it is easy to see where demand is most acute – rent is sloping from lower left to upper right and is at a high. The sales price, on the other hand, peaked in 2Q07. Here is the irony. It is possible the current momentum continues and rental units get overbuilt. We have seen this over and over across asset classes – the cycle of optimism followed by pessimism. In this scenario, the rate at which rents have risen will either stop or slow down. And in the ‘rent versus own’ debate, this becomes an important variable.