
Tuesday was J.P. Morgan’s (JPM) annual investor day. Bloomberg pointed out that CFO Marianne Lake talked about loans depleting a little bit – the growth rate, that is. Core loans were up 15 percent last year. She sees 10 percent this year.
This must have raised a few eyebrows.
Her comments are coming at a time when sentiment – ranging from CEO to investor to consumer – got a major boost post-November 8 U.S. presidential election. Sort of ‘animal spirits’ getting loose. But why is this not translating into loan growth – or is not expected to?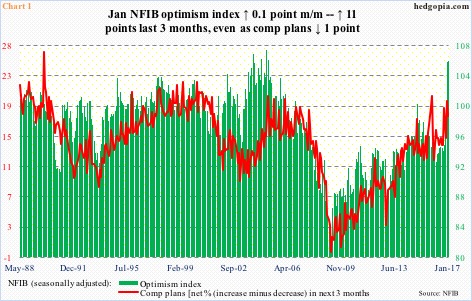
Post-election, business optimism jumped. But this is yet to get reflected in how businesses plan for the future.
Take the National Federation of Independent Business survey. In November through January, the optimism index surged 11 points to 105.9, which was the highest since 106.1 in December 2004. But during those three months, members’ compensation plans fell a point to 18 (Chart 1). (We will learn how February fared next Tuesday.)
NFIB members are notably optimistic, but not enough to feel comfortable to raise employee comp.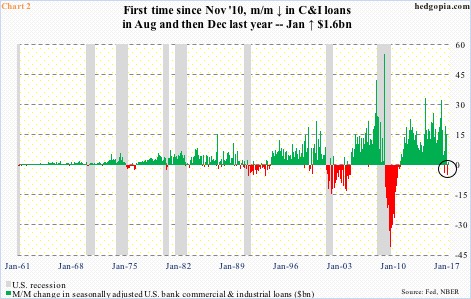
Based on Ms. Lake’s comments, these businesses are not going out there and planning to take out new loans either.
This is coming at a time when there are early signs of deceleration in U.S. banks’ commercial & industrial loans.
After peaking in October 2008 at $1.59 trillion, C&I loans bottomed two years later at $1.18 trillion, before persistently rising. So persistent that it was not until August last year they had their first month-over-month drop since that trough. Four months afterwards, these loans fell again in December. January was up a tiny $1.6 billion. The deceleration is evident in Chart 2.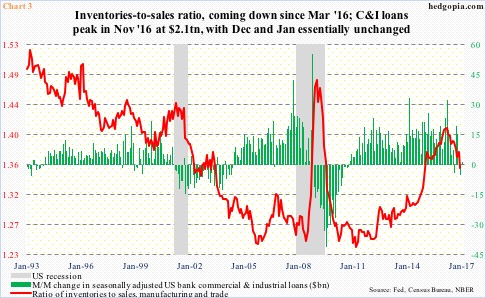
One reason for this is depicted in Chart 3, which plots m/m change in C&I loans with the inventories-to-sales ratio in manufacturing and trade. Last December, seasonally-adjusted inventories were $1.84 trillion and sales $1.36 trillion, for a ratio of 1.35. This is improvement from the cycle high 1.41 last March. Incidentally, the green bars have been dropping since that month, when loans grew by a whopping $32.3 billion m/m.
And, there is room for the red line to continue lower, with potentially the green bars in tow.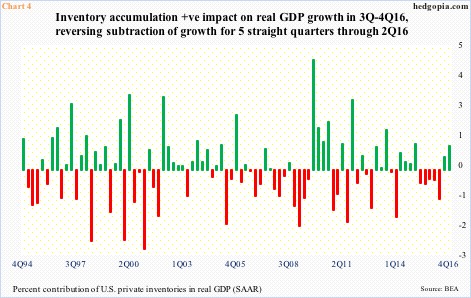
The second estimate of 4Q16 GDP also came out Tuesday. Growth in real GDP remained unchanged at 1.9 percent, down from 3.5 percent sequentially. One of the things that jumps out of the report is inventory accumulation, which contributed 0.94 percent to that 1.9 percent. In 3Q16, inventories contributed 0.49 percent. The two-quarter inventory accumulation reverses five consecutive quarters of inventory burn.
Hence growing odds of the red line in Chart 3 continuing lower. Unless the sales component in that ratio shoots up. Post-election, businesses are hopeful that that would be the case, but at the same time hesitate to invest toward that goal (Chart 1). Which is what the bars on the right side of Chart 2 are beginning to reflect.
Thanks for reading!
