
- 10-year notes yielding lower vs when Nov’s blockbuster jobs report came out
- Large speculators’ net shorts in 10-year-note futures at four-plus-year high
- Bond vigilantes not buying hopes and prayers of escape-velocity backers
Treasury bonds continue to catch a bid. A head-scratcher if you are a bond bear, particularly given the blockbuster November jobs report. The day that report came out (December 5th), the 10-year yield did rise five basis points, but it has been all downhill since. That has been the story pretty much since the last day last year when yields peaked at just north of three percent.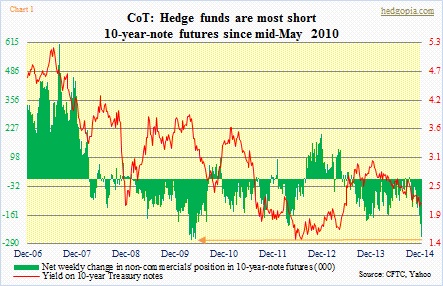
Hedge funds are not convinced this is going to continue. They have raised net shorts in 10-year-note futures to 258k contracts – highest since the middle of May 2010 (Chart 1). The last time they were net long for more than two weeks was end-June 2013. Most recently, they started adding to net shorts toward the end of September. The trade has not worked. Yields have gone down since. Now that they are stuffed to the gills with net shorts, this is the time to be asking a ‘what if’ question. What if they do not get the direction right? We could be potentially looking at a squeeze.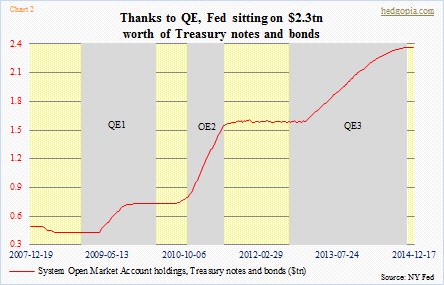
Bond bears have been calling for an end to the bull market in bonds for years now, and it has yet to pan out. Year-to-date, TLT is up nearly twice as much as SPY. Simplistically, now that the Fed is no longer buying Treasuries, that should have resulted in less buying pressure for bonds. But yields are lower versus October 31st. While it is difficult to make head or tail of this, the three iterations of QE has tremendously beefed up Fed’s holdings of Treasury notes and bonds. It is sitting on $2.3tn worth, up from just north of $400bn before QE1 began. Chart 2 depicts the from-lower-left-to-upper-right journey.
At the same time, improvement in the federal budget deficit means lesser need to issue new bonds. Early 2010, the deficit was $1.5tn (12-month running total), which has now come down to the $500bn range. While in 2010 the U.S. was issuing $1.7tn in Treasuries (12-month rolling total), it now issues half that.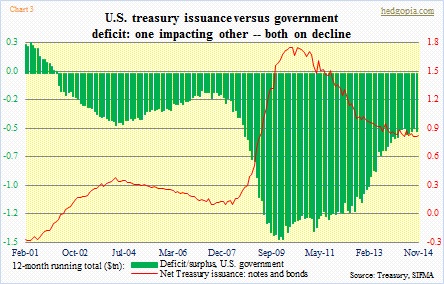
This is particularly important as there is no shortage of foreign demand for Treasuries. Chart 4 shows the five major foreign holders of Treasury securities. Particularly noteworthy is China’s journey from lower left to upper right. Fourteen years ago, it held $71bn in Treasuries. Now, it has $1.25tn. Japan is neck-and-neck with China now, but back then it held $308bn. During the period, the total amount of Treasuries held by foreign holders has risen $5tn to $6.1tn. These are astronomical numbers – not only the size but the slope of the buildup. From the debtor’s perspective, however, this has not dissuaded buyers from demanding for more.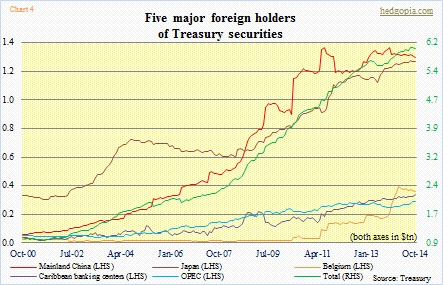
These are technical factors from the supply-demand perspective. And then we have the bond vigilantes. They continue to pay no mind to the hopes and prayers of escape-velocity proponents. Short rates will rise next year. That is the consensus call. Chair Yellen suggested as much in her post-FOMC press conference last Wednesday. But these vigilantes are not buying it. Kudos to them! They are on to something.
